Drawing Bar Charts on MetaTrader 4 Software
The third option on the charts menu in MT4 platform is the "Bar Chart" button. This button is used to select the drawing method of energies instrument movement as energies price bars.
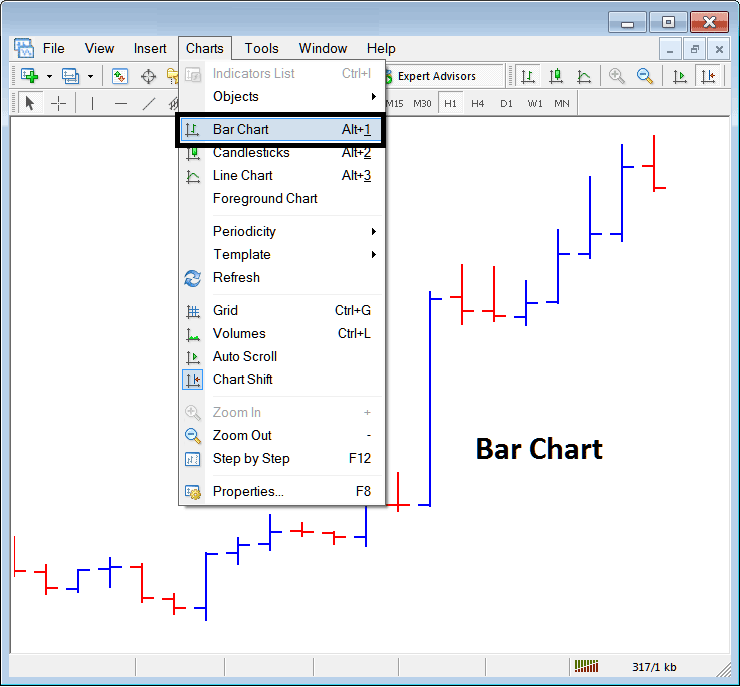
To trade on energies charts a trader may prefer to use the Bar Charts. The above menu button shows how a trader can select this option on the MT4 platform.
These are drawn using color coding:
- Red bar - Energies Price went down
- Blue bar - Energies Price market went up
These bars also have horizontal line to the left & to the right: these are used to explain the opening (left horizontal dash) & the closing (right horizontal dash).
highest point shows the high of the energies price
Lowest point shows the low of the energies price
These 4 points Open, High, Close & Low are Referred to as O.H.C.L, abbreviation of first letter for these 4 areas, these Four O H C L zones will be illustrated on each & every single price bar.
These charts are not very popular among Energies traders as they are not very appealing in terms of technical analysis & traders tend to favor other types.


