
Insert Shapes on Crude Trading Charts on the MT4 Platform
To place shapes on the MT4 oil platform, a trader can use the Insert Menu and use the insert shapes button that is shown below.
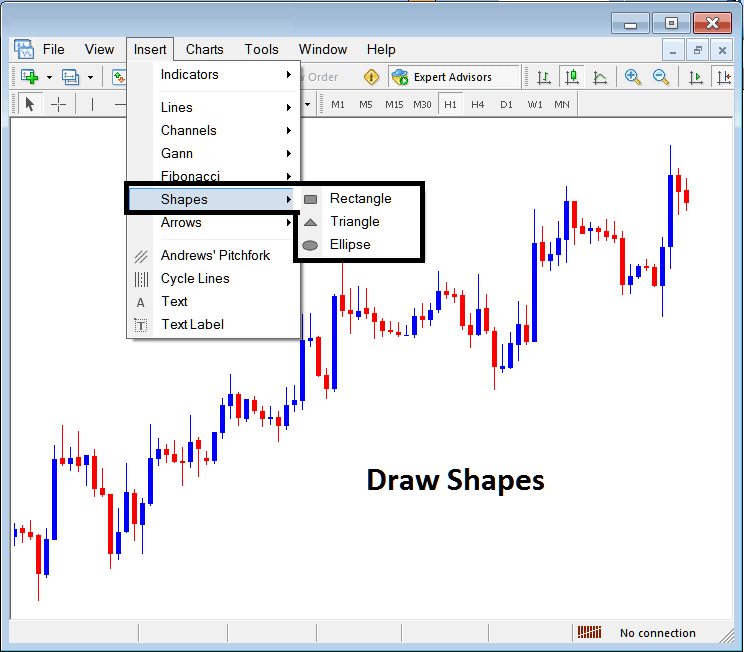
Insert Shapes on MT4 Software
Options of which shapes that can be drawn in the MetaTrader 4 platform are:
- Rectangle
- Triangle
- Ellipse
Draw Rectangle on Crude Oil Chart
To draw a rectangle on mMT4 oil charts, a trader will select the rectangle button & then choose between which points on a Oil Trading chart to draw this rectangle. To adjust a triangle that has already been drawn, a trader can also double click anywhere on this shape and then select the square buttons that appear at all the corners of this rectangle and drag them to adjust this rectangle.
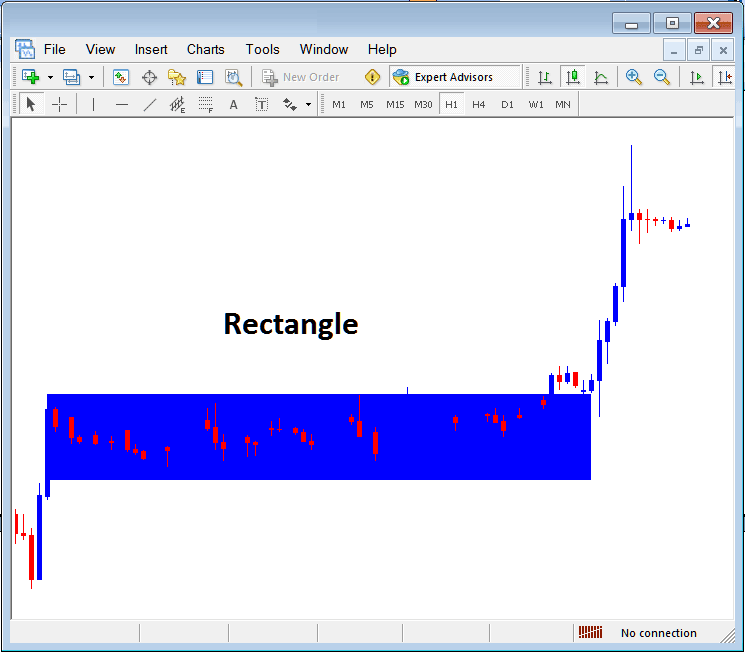
Drawing Rectangle Shape in MetaTrader 4 Oil Trading Charts
Rectangle shape is used to plot a consolidation range pattern where crude oil price break out to one side will mean crude oil price movement will continue in that direction, as shown above, when the crude oil price breaks out upwards it continues to move in that direction.
Draw Triangle
To draw a triangle, a trader can select the triangle button and then on the MT4 crude oil chart, select 3 points, point 1, 2 and 3 after which the triangle is drawn within these three selected chart points. To adjust the triangle, just double click this triangle, then select the square buttons appearing on the edges as shown below and adjust the triangle points.
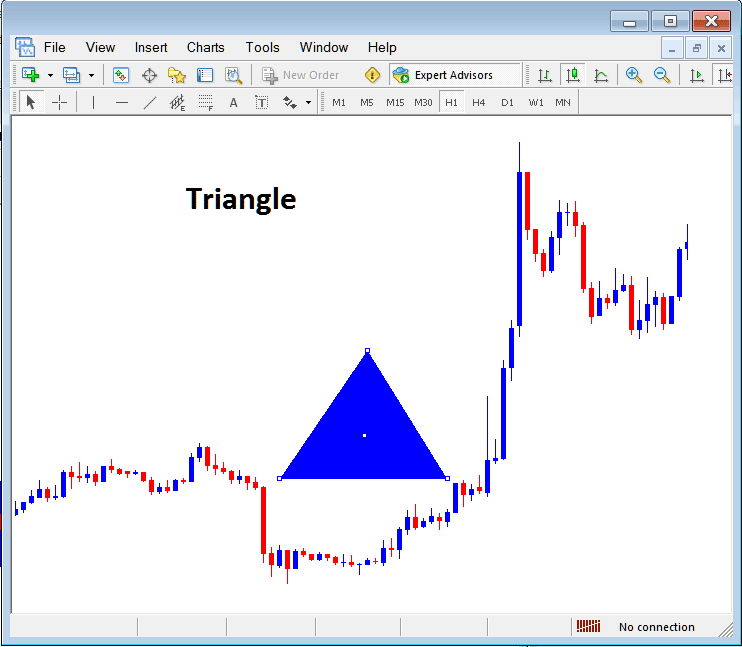
Drawing Triangle on Crude Oil Charts on MT4 Software
Draw Ellipse
To plot the ellipse shape, follow the procedure below:
- Select the Ellipse button as displayed above
- On the chart choose point 1 and drag the mouse to point 2, (the ellipse will appear as a line)
- Doubleclick the ellipse using the small squares at the middle, click, hold and drag this square and the ellipse will be adjusted as displayed below.
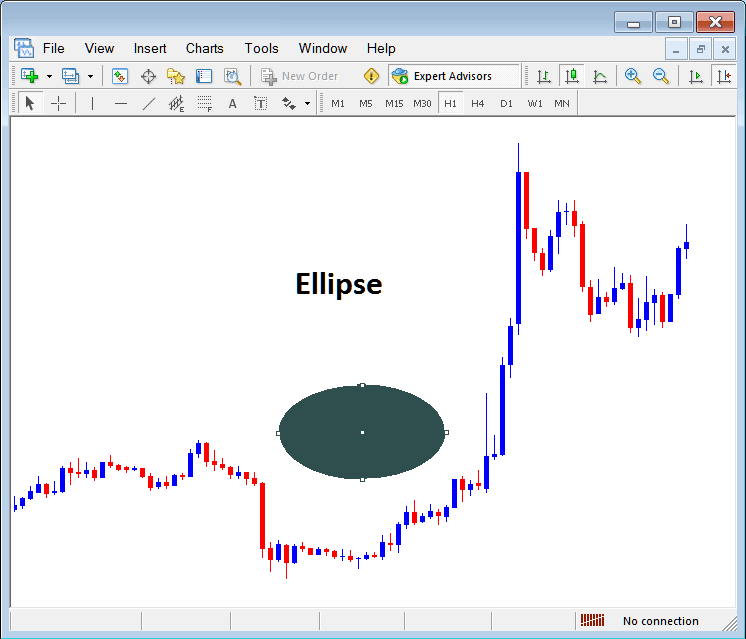
Drawing Ellipse Shape in MetaTrader 4 Oil Charts on MT4 Software


