
T3 Moving Average Oil Technical Analysis and T3 Moving Average Trading Signals
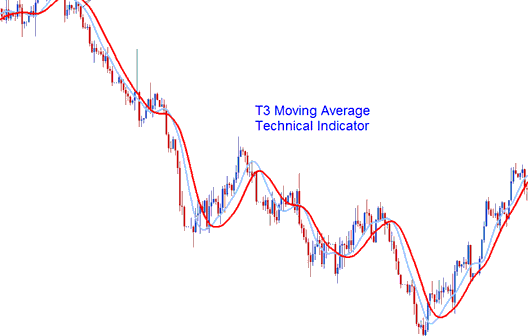
T3 uses a Smoothing factor/technique to produce trading signals that are similar to those of the moving averages, but are more accurate than those of the MA. The T3 is a modification of method used to calculate the original MA and it has a smoother curve and it does not lag the oil market as much as the MA. This Indicator follows crude oil price action and adjusts itself to the direction of the market.
Crude Oil Technical Analysis & How to Generate Trading Signals
The T3 moving average is similar to the original MA, and it can be traded in the same way as the original MA indicator.
Moving Average Crude Trading Crossover Trading Signal
This Method involves using two T3 MA and generating trading signals when the 2 cross each either upwards generating an upwards oil trend signal or cross downward generating a downward oil trend Signal.
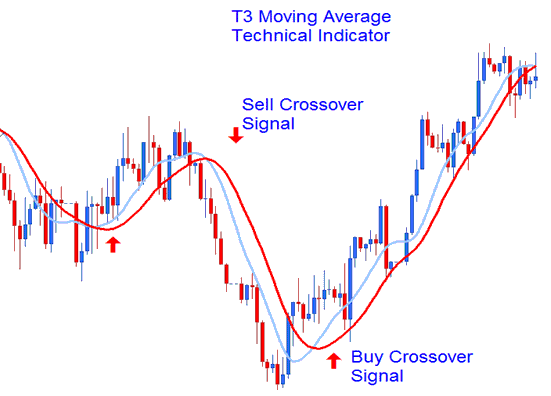 Crossover Signal
Bullish Crude Oil Trend - Oil Prices are bullish as long as crude oil price action remains above the indicator. When this move happens it implies that crude oil prices are bound to continue moving upwards.
Bearish Trend - Oil Prices are bearish as long as crude oil price action remains below the T3 Average. When the crude oil price is below the indicator it implies that crude oil price is bound to continue moving downwards.
Whipsaws - This is a smoothed indicator which is not prone to giving out whipsaws, since it's smoothed it's less responsive to crude oil price spikes, therefore a crude oil price spike will not skew the data used to calculate & draw it.


