
Inertia Oil Technical Analysis and Inertia Trading Signals
Developed by Donald Dorsey and was originally used to trade Stocks and Commodities market, before oil traders took it & started trading the crude oil market using this indicator.
Dorsey chose to name it "Inertia" because of his interpretation of the crude oil trend. He claimed that a oil market trend is the overall result of inertia and thus it takes more momentum for a trending market to reverse its direction than to continue moving in the same direction. Therefore, a oil trend is the measurement of market inertia. This is an oscillator that uses the scale of zero to a hundred. Signals are generated using the 50 level center line crossover method.
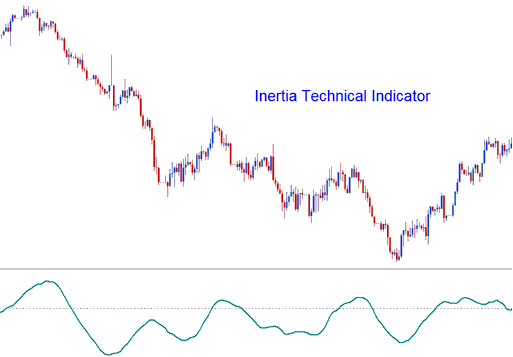
In physics, the term Inertia is defined in terms of mass and direction of motion. Using the standard technical analysis, the direction of motion of the oil trend can be easily defined. However, the mass cannot be easily defined. Dorsey claimed that the volatility of a financial instrument may be the simplest and the most accurate measurement of inertia. This theory led to the use of the Relative Volatility Index (RVI) as the basis to be used as a oil trend technical indicator. Therefore Inertia indicator is comprised of: RVI smoothed by a linear regression.
Oil Technical Analysis & How to Generate Crude Trading Signals
When it comes to trading the oil market using this indicator, the signals generated are fairly simple to interpret. Below are 2 example illustrated using oil charts showing how buy & sell oil signals are generated using Inertia.
Bullish Buy Trading Signal
If the Inertia is above 50, positive inertia is indicated, this therefore defines the long-term oil trend as upward as long as the indicator remains above 50. When it crosses to levels below 50 then this is interpreted as an exit signal. The chart below shows an example of how a buy crude oil trade signal is generated.
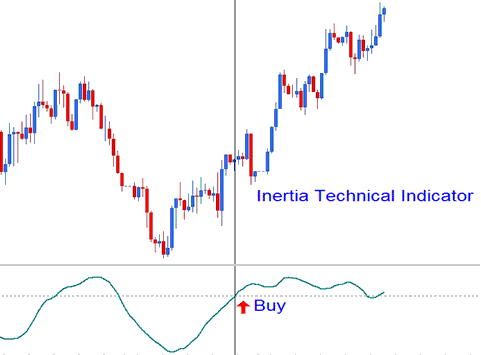
Upwards Oil Trend - Bullish Signal
Bearish Sell Crude Trading Signal
If the Inertia is below 50, negative inertia is indicated, this therefore defines the long-term oil trend as downwards as long as the indicator remains below 50. If it goes above 50 then this is interpreted as an exit signal. The oil chart below shows how a sell oil signal generated.
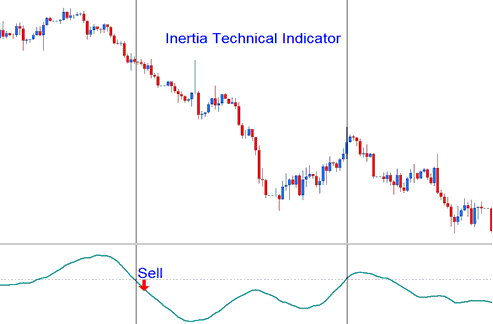
Downwards Oil Trend - Bearish Signal


