
Moving Average Support and Resistance Levels
Moving Averages can be used as points of support and resistance on crude oil charts.
When crude oil price reaches the moving average, the Moving Average level can act as a point of support or resistance for the crude oil price.
Buy Crude Trading Signal
If crude oil price is on an upward oil trend & starts to retrace, then most traders might wait to buy at a better crude oil price when the crude oil price hits a support level. Oil Traders will sometimes use the Moving Average to determine the support level.
A buy oil signal is generated when crude oil price hits the Moving Average, turns and starts moving in the upward oil trend direction. The oil signal is confirmed when crude oil price closes above the MA. Because many oil traders use the moving averages to generate oil signals, crude oil price will normally react to these levels.
A stoploss should be set just below the Moving Average oil Indicator. Ideally it should be set a few pips below the previous low.
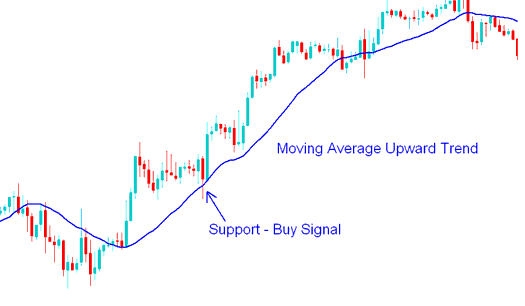
Buy Oil Signal - How to Trade Oil Trading with Moving Average Strategy
Sell Trading Signal
If the crude oil price is on a downward oil trend & starts to retrace, then most traders might wait to sell at a better crude oil price when the crude oil price hits a resistance level. Oil Traders will sometimes use the Moving Average to determine the resistance level.
A sell oil signal is generated when crude oil price hits the Moving Average, turns and starts moving in the downward oil trend direction. The oil signal is confirmed when crude oil price closes below the MA. Because many oil traders use the moving averages to generate oil signals, crude oil price will normally react to these levels.
A stoploss should be set just above the oil moving average indicator. Ideally it should be set a few pips above the previous high.
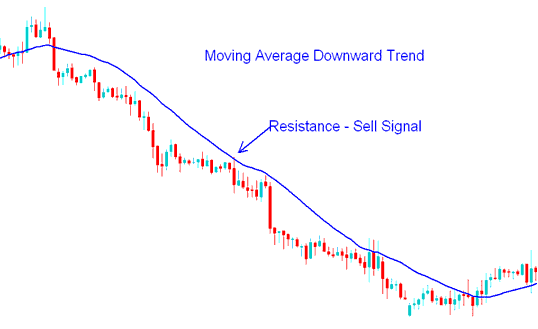
Sell Oil Signal - How to Trade Oil Trading with Moving Average Strategy
Resistance Level turns Support Level
In Crude Trading - When a resistance level is broken it turns into support and vice versa.
This happens when the fundamentals of a oil trend change and consequently the direction of a crude oil. Direction change is reflected by the moving average oil technical indicator, the direction is confirmed when resistance zone turns into support area or vice versa (when support level turns into resistance level)
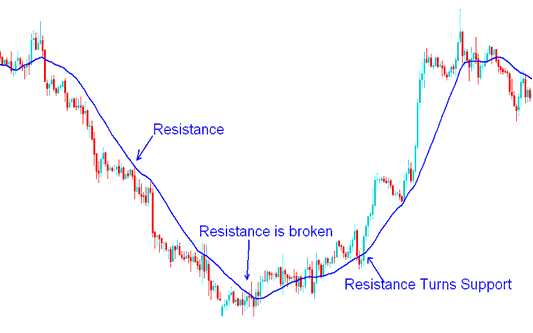
Resistance Level turns Support Level - Moving Average Oil Trading Strategy Example


