
Reversal Crude Trading Chart Patterns
These patterns are formed after the oil market has had an extended move up or down and the crude oil price reaches a strong resistance or support respectively.
When crude oil price reaches such a point it starts to form a pattern. Since these formations are frequently formed it's easy to spot them once you learn how & begin using them. There are four types:
- Double Tops
- Double Bottom
- Head & shoulders
- Reverse Head and shoulders
This learn oil tutorial will only cover double tops and bottoms, for the other 2, read this other tutorial: head and shoulders and reverse head and shoulders
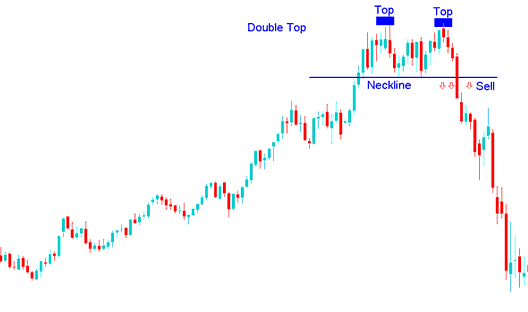
Double Tops
This is a reversal oil pattern which forms after an extended upwards crude oil trend. As its name implies, this formation is made up of 2 consecutive peaks which are roughly equal, with a moderate trough between.
This formation is considered complete once crude oil price makes the second peak & then penetrates lowest point between highs, known as neck-line. Sell oil signal from this formation occurs when the oil market breaks-out below neck line.
In Oil, this formation is used as an early warning signal that a bullish oil trend is about to reverse. However, it is only confirmed once the neckline is broken and the oil market moves below the neckline. Neckline is just another name for last support level formed on Oil chart.
Summary:
- Forms after an extended move upward
- This formation indicates that there will be a reversal in the crude oil market
- We sell when crude oil price breaks below the neck line point: see below for explanation.
The double tops look like an M-Shape, the best reversal oil signal is where the second top is lower than the first one as shown below, this means that the reversal can be confirmed by drawing a downwards oil trend line as shown below. If a trader opens a sell oil signal the stop loss will be placed just above this downward oil trend line.
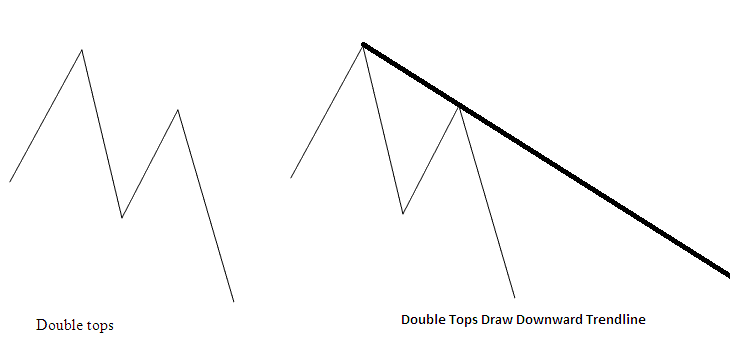
M Shaped
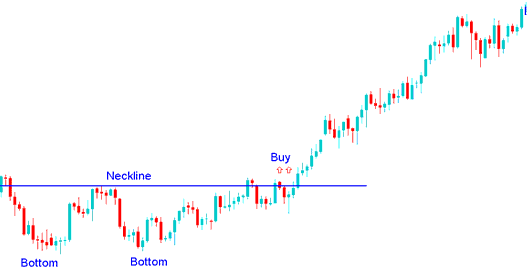
Double Bottoms
This is a reversal oil pattern which forms after an extended downwards crude oil trend. It is made up of 2 consecutive troughs which are roughly equal, with a moderate peak between.
This formation is considered complete once crude trading price makes second low and then penetrates highest point between the lows, known as the neck line. The buy indication from this bottoming out signal occurs when oil market breaks-out the neck line to the upside.
In Oil, this formation is an early warning signal that the bearish oil trend is about to reverse. It's only considered complete/confirmed once the neckline is broken. In this formation the neckline is the resistance level for the crude oil price. Once this resistance is broken the oil market will move up.
Summary:
- Forms after an extended move downwards
- This formation indicates that there will be a reversal in the crude oil market
- We buy when crude oil price breaks above the neck line point: see below for explanation.
The double bottoms pattern look like a W Shape, the best reversal oil trading signal is where the second bottoms is higher than the first one as displayed below, this means that the reversal can be confirmed by drawing an upward oil trend line as shown below. If a trader opens a buy oil signal the stop loss will be placed just below this upward oil trend line.
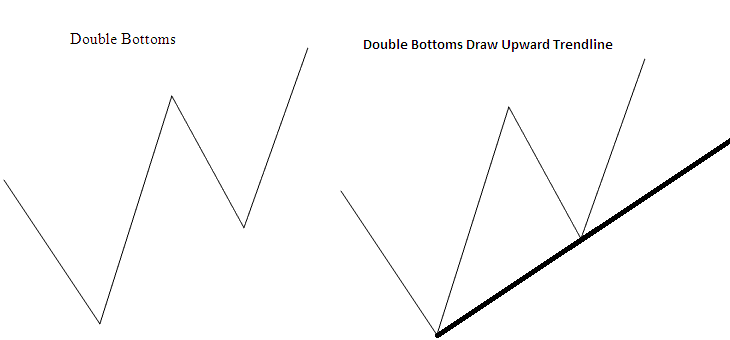
W Shaped


