Spinning Tops Candle Pattern and Dojis Candlestick Patterns
Spinning Tops Candlestick Patterns
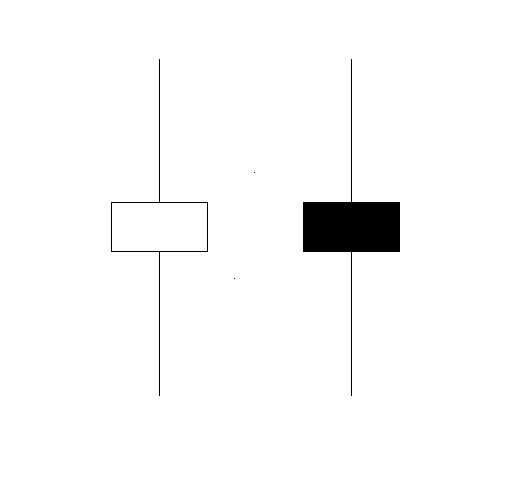
Spinning tops candles show a small body with long upper and lower shadows. People call them spinning tops because they look like a top on a matchstick.
The upper and lower shadows of the spinning tops are longer than the body. The example shown & described below displays the spinning top pattern. You can look for the pattern on your MT4 Software charts. The examples shown and explained below shows a screenshot to help the Gold traders when it comes to learning & understanding these setups.
How to read candlestick charts - Spinning Tops
Colour of the spinning tops candlestick isn't very important, this formation show the indecision between the buyers(bulls) & sellers in the market. When these patterns appear at the top of a market trend or at the bottom of the price trend it might that the price trend is coming to an end and it might soon reverse and begin heading in the other direction. However, it is better to wait for additional confirmation trading signals that the direction of a market has reversed before trading the trading signal from this chart formation.
Candlestick Stick Reversal Patterns Formations on Charts
When a black/red spinning top appears at the top of an upward trend, a change is more likely than if the candle is white/blue.
At the bottom of a downwards trend a white/blue spinning top shows that a reversal is more likely than when the color is black/red.
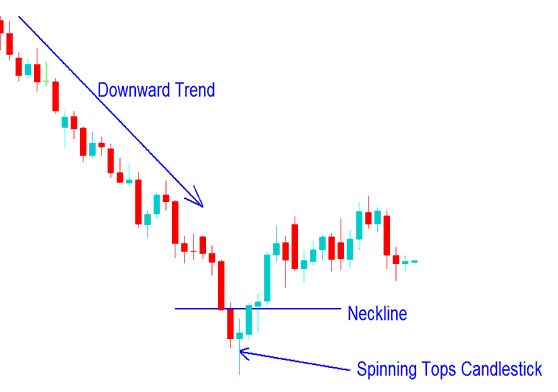
The reversal signal is validated by the next candlestick pattern setup formation, which closes below the neck line for a reversal setup in a downward trend and above the neck line for a reversal setup after the spinning tops candlestick closes.
The neck line is:
- For an Upwards Trend - The open of the previous candlestick that was drawn just before the spinning top candlestick.
- For a Downward Trend - The open of the previous candlestick that was drawn and formed just before the spinning top candlestick
Shown Below is example of this Japanese charting techniques where this setup has formed & how to trade it. On the chart below when price moved above the neck line the reversal setup given by the spinning top candlestick was confirmed and this was a good point to exit the short sell trade.
Spinning Tops Pattern on Chart
The spinning tops candlestick that was created is blue in color, so a reversal was more likely than if the color had been red instead.
Doji Candlesticks Pattern
This is a pattern where the xauusd price opens and closes at the same point. There are different types of doji candle patterns on charts.
following example describe different patterns of the doji candlestick:
Long-legged doji candlestick has long upper and lower shadows with opening & closing xauusd price at the middle. When the Long legged doji pops up on Gold chart it demonstrates indecision between the gold traders, buyer & the sellers(bears).
Shown Below is example screen-shot image screen shot of the Long Legged
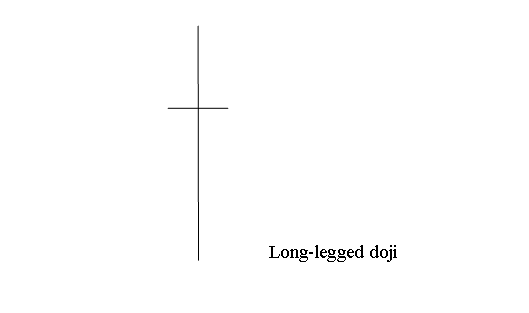
- Doji chart pattern
Cross Doji Gold Candle
A cross doji features a lengthy lower shadow and a short upper shadow, with the opening and closing prices being identical for the period.
This pattern formation usually emerges at market turning points, signaling a potential reversal in price trend direction. An example of this chart pattern is illustrated below.
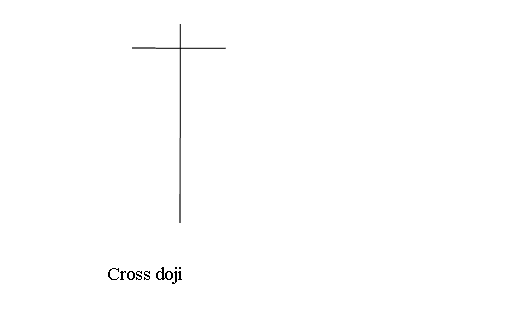
- Cross Doji Candlestick Pattern
Inverted Cross Doji Candle Pattern
Inverted cross doji candles are characterized by a long upper shadow and a short lower shadow, with the opening and closing prices coinciding.
This pattern that shows a change pops up at turning points in the market and warns that the price might change direction. Below is a picture to show it.
- Inverted Cross doji
Analyzing Gold/U.S. Dollar Trading - Every doji candlestick pattern shows that the market is unsure, because at the highest point, the buyers were in complete control, and at the lowest point, the sellers were in control, but neither could stay in control, and when the market closed, the price was the same as when it started for that trading time. This doji shows that the total price change for that candlestick trading time was zero pips, or just a very small range of 1 to 3 pips. To understand these chart patterns, you need to see very small pip changes between the starting and ending prices of gold/u.s. dollar.
Get More Courses & Guides:
- How Do You Read a New XAU USD Order on MT4 iPhone Trading App?
- How to Add Instant Market Execution MetaTrader 5 Gold Order
- Drawing Upwards Channel in MetaTrader 4 Charts Described
- Rainbow Charts Technical XAU/USD Indicator Analysis
- Gold Analysis Live Trading Charts
- How Do You Open a Real MT5 Gold Account in MetaTrader 5 Software Platform?

