The Elliott Wave Theory in Gold Trading
This is a form of technical analysis that Gold traders and other investors use to forecast trends in the xauusd markets by identifying extremes in investor psychology, highs and lows in xauusd trading prices, and other collective activities. This gold trading theory model shows that collective human psychology develops in natural patterns over time, through buying & selling trading decisions reflected in market xauusd prices.
This theory of analysis was developed by Ralph Nelson Elliott that is based on the theory that, in nature, many things happen in a five-wave pattern. These patterns are also applied to technical analysis, to analyze the behavior of Gold market trends using this technical analysis theory.
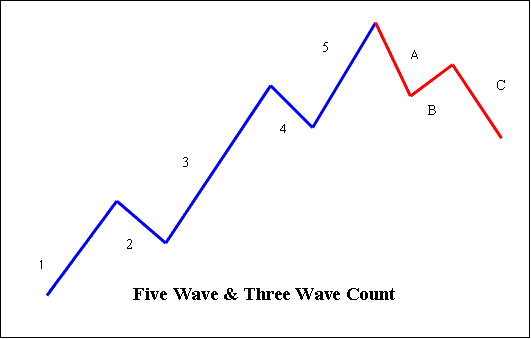
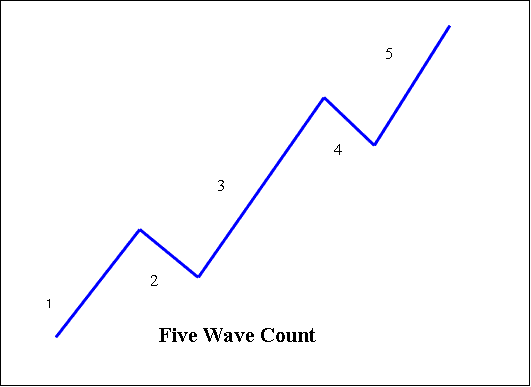
When this theory is applied to Gold, the assumption is that the xauusd market will advance in a pattern of five waves - three up moves, numbered 1, 3 and 5 - which are separated by two down moves, number 2 and 4. When the three upward moves (1, 3, 5) are combined with the two downward moves (2, 4), they form the 5 Wave trading pattern.
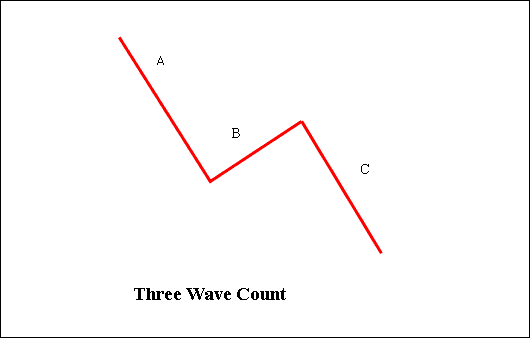
The technical analysis theory further holds that each five-pattern up move will be followed by a down move also consisting of a three-pattern down moves - this time, three down ones are not numbered but use the letters A, B and C. So as to differentiate them from the 5 ones for the up move.
5 and 3 Wave Pattern
The main gold trend will comprise five moves while the retracement will comprise 3 moves.
Five pattern (dominant trend) - uses 1, 2, 3, 4, 5
Three pattern (corrective trend) - uses A, B, C
This article is about how to trade online gold markets using the Elliott Theory as the driving force of gold trading instruments. This model relies heavily on looking at xauusd trading price charts. Technical analysts use this theory to study developing Gold trends to identify the waves and discern what xauusd trading prices may do next.
By analyzing these patterns on a gold chart and applying the Elliott Theory, gold traders are able to decide where to get in and where to get out by identifying points at which the xauusd market is likely to turn.
One of the easiest places to see this theory at work is in the xauusd market, where changing investor trading psychology is recorded in the form of xauusd trading price movements. If a trader can identify repeating patterns in xauusd trading prices, and figure out where these repeating gold trading pattern is relative to the Elliot pattern counts then the trader can predict where xauusd prices are likely to head to.
Rules for Elliott Count in Gold Trading
Based on the xauusd market patterns formations formed by this trading theory, there are several guidelines & rules for valid Counts:
- Wave 2 should not go below the beginning of Part 1.
- Wave 3 should be the biggest among Part 1, 3 & 5.
- Wave 4 should not overlap with Part 1.
Five pattern (dominant trend)
1: This one is rarely obvious at its inception. When the first wave of a new bull market begins, the fundamental news is almost universally negative. The previous gold trend is considered still strongly in force. Fundamental analysts continue to revise their estimates lower; the beginning of a new trend probably does not look strong. Sentiment surveys are still bearish and the implied volatility in the xauusd market is high. Volume might increase a bit as xauusd trading prices rise, but not by enough to alert many technical trading analysts.
2: This one two corrects 1, but can never extend beyond the starting point of wave one. Typically, the news is still bad. As xauusd trading prices retest the prior low, bearish sentiment quickly builds, and "the crowd" mentality reminds all that the bear market is still in force. Still, some positive signs appear for those who are looking: volume should be lower during 2 than during 1, xauusd trading prices usually do not retrace more than 61.8% of 1 part one gains. Gold Price will reach a low that is higher than the previous low resulting into a higher low.
3: This is usually the largest & most powerful move upward, larger than 1 and 5. News is now positive and fundamental analysts begin to raise estimates. Gold Prices rise quickly, corrections are short-lived & shallow. Anyone looking to get in on a pullback will likely miss the boat. As 3 starts, the news is probably still somewhat bearish, and most traders remain negative: but by part 3 midpoint, the crowd will often join in and agree the new market sentiment is bullish. Wave three will extends beyond the highest level reached by 1.
4: This is typically and clearly corrective. Gold Prices may move sideways for an extended period, & 4 typically retraces less than 38.2% of 3. Volume is well below that of wave three. This is a good place to buy a pull back if you understand the potential ahead for a Part 5. Still this 4 is often frustrating because of their lack of progress in the larger upward trend.
5: This is the final leg in direction of the dominant trend. The news is almost universally positive and everyone is bullish. Unfortunately, this is when many average investors finally buy in, right before the xauusd trading price hits the top. Volume is often lower in 5 than in wave three, and many momentum indicators start to show divergences (xauusd trading prices reach a new high but the indicators don't reach new highs). At the end of a major bullish trend, bears might very well be ridiculed, for trying to pick a market top.
Three Pattern (Corrective Trend)
A: Corrections are typically harder to identify than impulse moves. In A of a bearish market, the fundamental news is usually still positive. Most analysts see the drop as a correction in a still active bullish market. Some gold indicators that accompany A include increased trading volume, rising and implied volatility and possibly a higher open interest in short selling.
B: Gold Prices reverse & move slightly higher, which many see as a resumption of the now long gone bullish trend. Those familiar with classical technical analysis might see the peak as the right shoulder of a head and shoulders reversal gold pattern. The volume during B should be lower than in A. By this point, fundamentals are probably no longer improving, but they most likely have not yet turned negative.
C: Gold Prices move impulsively lower. Volume picks up, and by the third leg of C, almost everyone realizes that a bearish gold trend is firmly entrenched. C is typically at least as large as A and often extends to 1.618 Fibo expansion level beyond A lowest point.


