TSI True Strength Index EA Setup - Setting Up TSI True Strength Index Expert Advisor
TSI True Strength Index EA Setup - Setting Up TSI True Strength Index EA - A trader can come up with an TSI True Strength Index EA based on the TSI True Strength Index indicator explained below.
TSI True Strength Index EA rules can be combined with other Forex technical indicators to come up with other Expert Advisor Forex Robots that trade using rules based on two or more indicators combined to form a trading system.
True Strength Index (TSI) Forex Trading Technical Analysis & TSI Signals
Developed by William Blau
True Strength Index is a momentum indicator. The TSI is plotted by using a momentum calculation that reacts faster and is more responsive to price changes, making it a leading indicator that follows price action direction closely in the forex market.
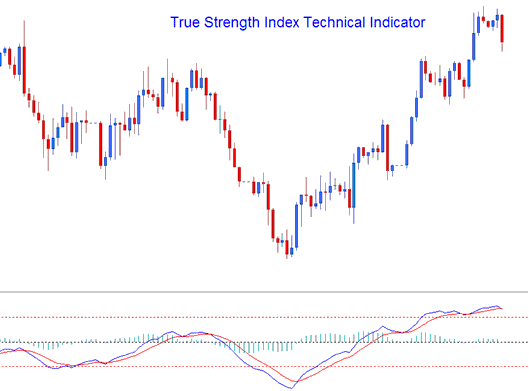
The True Strength Index is plotted as a blue line, the indicator also plots a signal line which is plotted as a red line, and these two lines are used to generate crossover signals.
True Strength Index also plots a histogram which shows the difference between the TSI Line and the Signal line. This histogram crosses above or below the center lines, histogram levels above the center line shows a bullish crossover signal, while center line levels below the center line shows a bearish crossover signal.
TSI True Strength Index EA Setup
Forex Analysis and Generating Signals
The TSI uses various methods to generate trading signals. This indicator can be used in the same way as the RSI to determine general trend direction of the currency markets. Overbought and oversold levels can also be shown using TSI. The most common methods of generating trading signals are:
Zero line FX Trading Crossover (Histogram Forex Trading crossover not Lines FX Trading crossover)
- Buy - when the histogram crosses above 0 a buy is generated
- Sell - when the histogram crosses below 0 a sell is generated
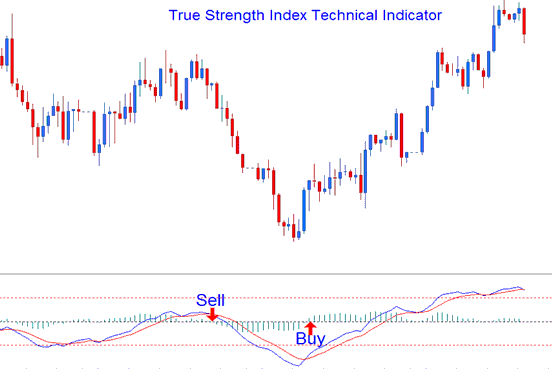
Buy & Sell Signal - Forex TSI True Strength Index EA Setup
FX Trading Signal line Forex Trading Crossover
- A buy is generated when TSI line crosses above Signal Line
- A sell is generated when TSI line crosses below Signal Line
This signal is the same as the one above and the timing corresponds to the time when the histogram crossovers happen.