Short Term Silver Trading with Moving Averages
Short Term Moving Averages Indicator Strategy
Short term silver trading will use short xagusd price periods like the 10 and 20 moving average price periods.
In the xagusd trading example explained and shown below we use 10 and 20 Simple Moving Average to generate signals: the signals generated are able to identify the trend as early as possible.
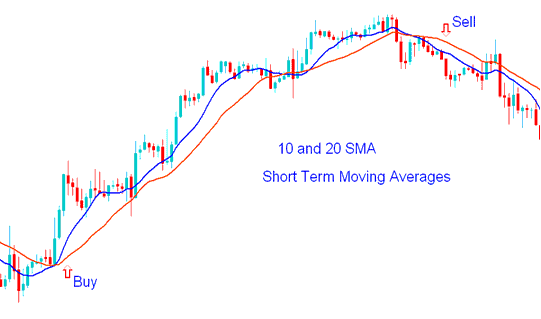
Short-term Silver Trading with Moving Averages - How to Trade Silver with Moving Averages Example
Using Moving Averages
One of the most widely used method of technical analysis that is used to analyze chart trends in scalping is the use of moving average indicator.
The idea behind this moving average indicator is to simply enhance technical analysis before taking a signal to enter the xagusd market. Planning and setting silver trading goals in the short term according to moving averages helps a scalper trader to identify trends in the xagusd trading market and thus open a trading order accordingly.
Most of the signals can be established using a specific xagusd price period for the Moving Average Technical XAGUSD Indicator. The silver trading Moving average indicator determines whether the trader will trade in the short term or long-term. In addition, the xagusd price action is above or below this moving average indicator it determines the trend of the xagusd trading market for the day.
If a large part of the silver market xagusd price is considered to be below the Moving average indicator, then bias trend for the day is downward. Most traders they use the MA Indicator as support or resistance to determine where to open a trade position, if xagusd price touches the Moving Average in direction of the silver market trend a trade is then opened.
The silver trading moving averages are drawn and the intersection point with the xagusd price can be used to determine the appropriate entry and exit times in the xagusd trading market. Since there is always oscillation in the xagusd trading market trends and the xagusd trading market will repeat this process of oscillating and bouncing off the Moving Average and this can be used to generate buy or sell trading signals.
Simple moving averages are calculated and their approach is based on the observation of the xagusd price within a particular period of time using sufficient data to calculate it. Their interpretation has provided many silver trading scalpers with lots of tips on how and when to open silver scalping trading.
Medium Term Strategy
Medium term silver trading moving average trading strategy will use the 50 period Moving Average.
The 50 period Moving Average acts as support or resistance level for the xagusd price.
In an upward silver trend the 50 period Moving Average will act as a support, price should always bounce back up after touching the Moving Average. If the xagusd trading market closes below the indicator then this will be an exit signal.
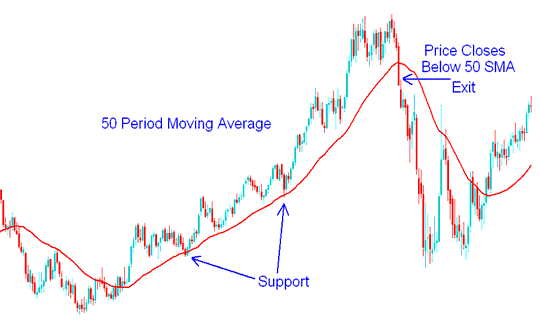
50 Moving Average Period Support - Trading Strategy Examples
In a down silver trend the 50 period Moving Average will act as a resistance, price should always go down after touching the moving average. If the xagusd trading market closes above this indicator then this is an exit signal.
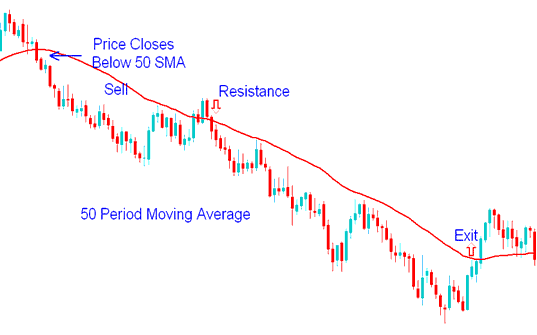
50 Moving Average Period Resistance - Silver Strategies Examples

50 Day Moving Average Technical Analysis
As the trend moves upwards, there is a key line you want to watch - this is the 50 day silver trading moving average. If the xagusd trading market stays above this 50 day silver trading moving average, that is a good signal. If the xagusd trading market drops below the 50 day silver trading moving average in heavy volume, watch out, there could be trend reversal signal ahead.
A 50 day MA silver indicator takes 10 weeks of market data, & then plots the average. Moving line is recalculated everyday. This will show the trend - it can be up, down, or sideways.
You normally should only buy when prices are above their 50 day silver trading Moving Average. This tells you the current market direction is trending upward. You always want to trade with the trend, and not against it. Many traders only open orders in direction of the trend.
Xagusd prices normally will find support over and over again at this 50 day silver trading moving average. Big investing institutions watch this level closely. When these big volume entities spot a trend moving down to its 50 day line, they see it as an opportunity, to add to, or start a new trade position at a reasonable level.
What does it mean if xagusd price moves downward and slices through its 50 day line. If it happens on heavy volume, it is a strong signal to sell. This means big institutions are selling their share, and that can cause a dramatic drop in price, even if fundamentals still look solid. Now, if xagusd price drops slightly below the 50 day line on light volume, watch how it acts in the following days, and take appropriate action if necessary.
Long Term Strategy
Long term trading strategy will use long period such as the 100 and 200 MAs which act as long term support and resistance levels. Since many traders use these 100 and 200 silver trading moving averages, the xagusd price will often react to these support and resistance areas.
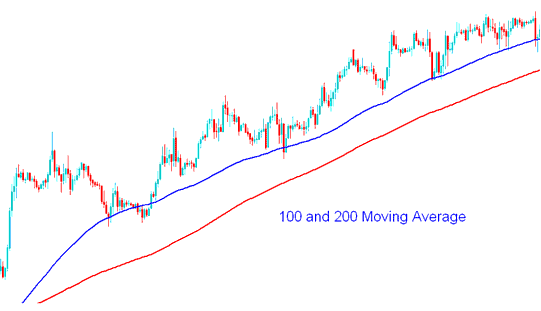
100 & 200 MAs - How to Trade Silver Using MA Silver Strategies Methods
In Silver, traders can use both fundamental analysis and analysis to help determine whether silver is a good buy or sell.
In silver analysis technique traders looking to gauge supply and demand for silver use the 200 day moving average to examine data in different ways.
Traders are most familiar with the basic silver analysis of the 200 day Moving Average which is used to draw the long term support or resistance level. If xagusd price is above 200 day Moving Average then the trend is bullish, and if it is below it then silver trend is bearish.
One of the ways to measure supply and demand in silver trading is to calculate the average closing xagusd price over the last 200 sessions. This xagusd trading moving average accounts for each day going back in time and shows how this 200 day average has moved.
The reason why the average 200 day Moving Average in particular is so popular in silver analysis is because historically has been used and it produces good results for trading in the xagusd trading market. A popular timing trading strategy is used to buy when the xagusd trading market is above its moving average of 200 days and sell when it goes below it.
With this moving average indicator, traders can benefit from being notified when price rises above, or falls below its 200 day Moving Average and then silver traders can then use their analysis to help determine if the signal is an opportunity to go long or short.
What is a Trading Plan? - Writing a Plan Example Template
Alternatives: EA Automated Robots or Copier Trading Signals

