Types of Gold Traders
There are various types of gold traders & each type is determined by the amount of time that they hold their open trades and the lot sizes which they trade.
The most common trading types are:
- Scalpers
- Day Traders
- Swing Traders
- Position Traders
Scalpers
This is one of more popular methods of trading gold, traders will open & hold their trades transactions for a period of a couple of minutes only and profit from only a few pip(point) movement. Traders will use the one minute charts to determine the current market trend & open trade positions using this one minute chart. Scalper Traders will aim to make a profit of between 200 and 300 points per trade. 100 points is equal to $1 dollar change in the xauusd price, thenceforth this profit target is a $2 to $3 dollars change in price.
Day Traders
These traders will open and close trades during the same trading day & won't hold overnight trades. Day traders will use the 5 Minute or 15 Minutes trading charts to determine the trend direction & open trade transactions using these charts. The day traders will hold their trades open for a few hours & try to make profits from the intraday market trends.
Day traders will aim to make a profit of between 700 and 900 points per position. 100 points is equivalent to $1 dollar change in the gold price, therefore this profit target is a $7 to $9 change in price.
Swing traders
These traders open trades & hold them for a few days so as to earn profits from the intraweek trend that lasts for 2 or 3 days. These traders will sometimes leave their open trades overnight so as to catch more trading profit from the intraweek trend.
These traders will use the 1 hour forex charts to determine the trend of the market and place transactions using this chart timeframe.
Swing traders will aim to make a profit of between 2000 & 5000 points per position. 100 points is equal to $1 dollar change in the xauusd price, therefore this profit target is a $20 to $50 change in price.
Position Traders
These traders will hold their trades open for a few weeks to a few months and they will place trades that aim to earn profits from the medium-term & long term trend of the gold prices.
Position traders will use the Daily and Weekly charts to determine the trend & place trades using these daily and week charts. Position traders will aim to earn a profit of between 20000 and 40000 points per position. 100 points is equal to $1 dollar change in the xauusd price, therefore this profit target is a $200 to $400 change in price.
About Day Trading Method
The most popular method of trading xauusd is the day trading method, most traders prefer to day trade gold and open & close-out their trades within the trading day. These traders will hold their trades open for only a couple of hours. This way a trader will aim to make profits of between 700 and 900 points which is the average daily movement of xauusd gold prices. At the same time a gold trader can close out their trades quickly in case the trend moves against their trade direction.
100 point movement is equivalent to a one dollar change in the market price of gold per ounce. For example if xauusd moves from $1250 to $1251, this will represent a 100 point move in gold prices.
Day Trading Example
The example below illustrates 15 minute trading chart that is used for day trading. The day trader will use this 15 Minutes trading chart to open trades. The trend below is upward thence a gold trader would have opened a buy position. If the trader bought 1 gold lot at the price of $1210 dollars per ounce & closed the trade at $1242 per ounce, this would be a $32 change in the price per gold ounce which is equal to a 3200 points change: this is because the gold price is quoted using 2 decimal points.
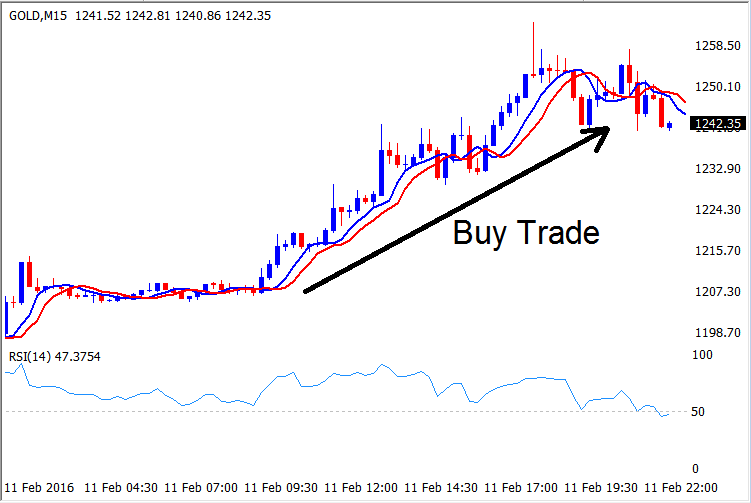
The profit of xauusd for every point is $1, therefore for this trade is $3,200 from this position.
Day traders will only trade using the 15 minutes chart and hold their open trade positions as long as the trend is moving in their trade direction. Once the market trend on the 15 minute chart changes, then traders will close all their open trade positions and wait out for another trade set-up before opening another trade.
In the example above a trader would close their buy trade at $1242 because this is where the direction of the market changed like as displayed and shown by the two moving averages that have reversed their direction & both have started to move downward.
The above trend is determined on the 15 minutes gold trading chart. This trade was opened & only lasted for ten hours & a gold trader would have closed the trade after this time and wait for another trade setup the following day.
More Guides & Lessons:
- MT4 XAU USD Technical Indicators Insert Menu in MT4 Insert Menu Options
- XAUUSD Use XAUUSD Sell Limit Order in MT4 Platform Software
- Trade Gold Patterns
- Rate of Change Indicator Shown
- Trade with Shortterm & Long term Gold MAs XAU/USD Strategies


