Reversal Patterns Double Tops and Double Bottoms Patterns
Reversal chart patterns form after the market has had an extended move up/down & the market price reaches a strong and major resistance level or support area respectively.
When price reaches such a point it starts to form a chart setup - reversal chart pattern. Since these setups are frequently formed & shaped it's easy to identify them once you learn how & begin using them.
There are four types of reversal patterns:
- Double Tops
- Double Bottom
- Head and shoulders
- Reverse Head and shoulders
This guide will only cover double tops & double bottoms chart patterns, the other 2 will be covered in the next tutorial: head & shoulders & reverse head & shoulders chart pattern.
Double Tops - Reversal Pattern
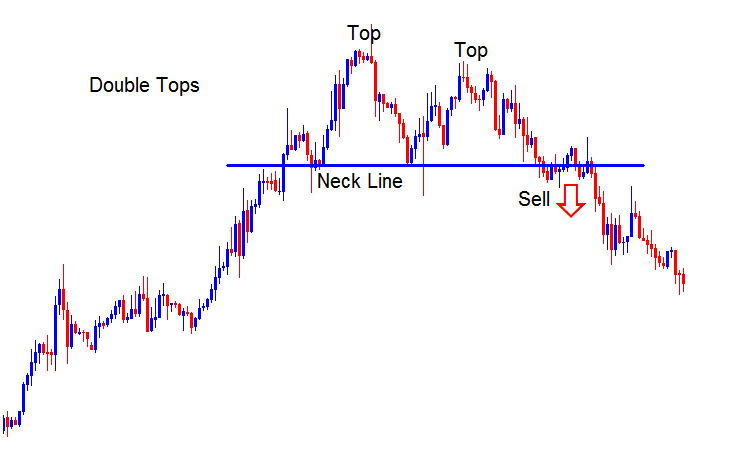
This double tops chart pattern formation is a reversal chart setup that forms after an extended upwards market trend. As its name implies, this setup formation is made up of 2 consecutive peaks which are roughly equal, with a moderate trough in between.
This double tops setup formation is considered complete once the price makes the second peak and then penetrates the lowest point between the highs, called the neckline. The technical sell signal from this reversal chart pattern formation setup occurs when the market breaks below the neckline.
In XAU/USD trading, this setup formation is used as an early warning signal that a bullish Gold price trend is about to reverse. However, it is only confirmed once the neck line is broken & the market moves below the neckline. Neckline is just another name for the last support level formed on the Gold price chart.
Summary:Forms after an extended move upwards
This setup formation shows that there'll be a reversal in the market
We initiate a sell when the price breaks below the neckline: refer below for further explanation.
Double Tops Reversal Pattern
The double tops reversal pattern look like an M-Shape, the best reversal signal is where the second top is lesser than the first one as is shown below, this means that the reversal setup can be confirmed by drawing a downward trendline just as shown below. If a trader opens a sell trade the stop loss will be placed just above this downward trend line.
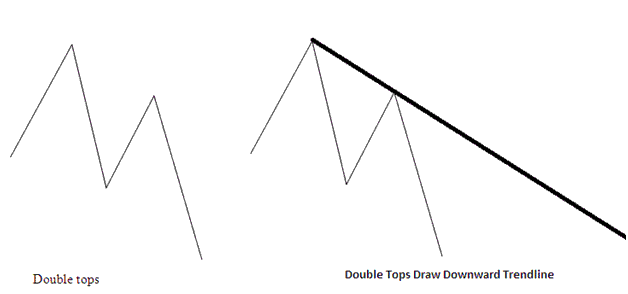
M-Shaped Double Tops Reversal Chart Pattern - Downwards Trend Line
Double Bottoms - Reversal Chart Pattern
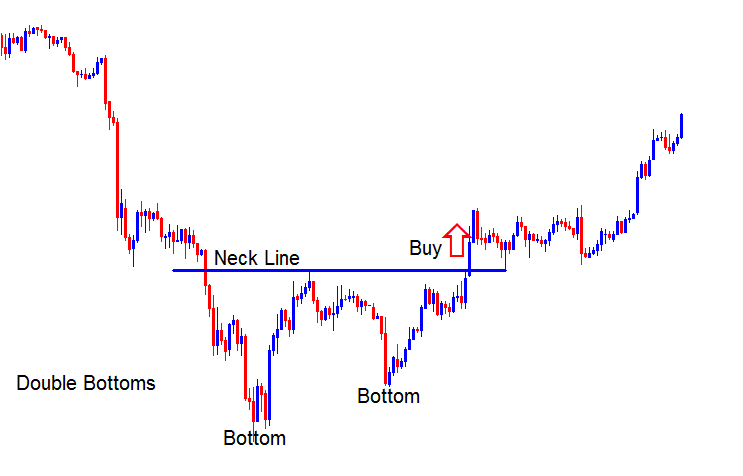
Double bottoms is a reversal trade pattern that forms after an extended downwards trend. It is made up of two consecutive troughs which are roughly equal, with a moderate peak in between.
This double bottom reversal chart pattern setup formation is considered complete once the price makes the second low & then penetrates the highest point between the lows, called the neckline. The buy indication from this bottoming out signal occurs when the market breaks the neckline to the upside.
In XAU/USD trading, this setup formation is an early warning that the bearish Gold price trend is about to reverse. It is only considered complete/confirmed once the neckline is broken to the upside. In this setup formation the neckline is the resistance level for price. Once this resistance is broken the market will move upward.
Summary:Forms after an extended move downwards
This setup formation reflects that there'll be a reversal in the market
We buy when the price breaks above the neckline: see below for an explanation.
Double Bottom Reversal Chart Pattern
The double bottoms pattern resembles a W-Shape, the best reversal signal is where the second market bottom is higher than the first one like is shown below, this means that the reversal setup can be confirmed by drawing an upward trendline just as shown below. If a gold trader opens a buy trade the stop loss will be placed just below this upward trendline.
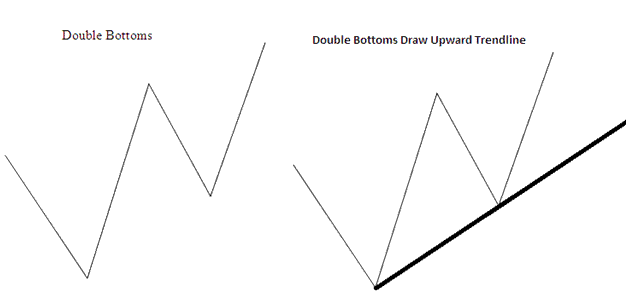
W-Shaped Double Bottom Reversal Chart Pattern - Upward Trend-Line
More Guides & Lessons:
- Insert XAU/USD Tools Text Label, Andrew's Pitch Fork, Cycle Indicator MetaTrader 4 Platform
- What's a Nano Lot in XAU/USD for Nano Gold Account?
- XAUUSD 20 Pip a Day Strategy
- How to Place Momentum Indicator on XAU/USD Chart in MT4 Platform Software
- Gann Trend Oscillator XAU/USD Indicator Analysis
- How to Add Moving Average Oscillator XAU/USD Indicator on Chart
- Types of Gold Orders
- An Introduction to Gold Trading
- Free Gold Indicators Explained
- How Fast Gold Moves and Spotting Gold Trends for XAU/USD


