
Drawing Fibonacci Retracement Levels in MT4 Platform Software
To calculate price pullbacks on assets such as XAUUSD (gold), use the Fibonacci retracement tool available on the MT4 platform, as demonstrated in the provided screenshot.
If you intend to examine Gold price charts using this specific utility, it is already integrated within the MT4 software. The subsequent instructions detail how to incorporate this tool into the MT4 platform. On MT4, this Fibonacci retracement tool will automatically plot the retracement levels onto a price chart once the indicator is positioned over the Gold price action.
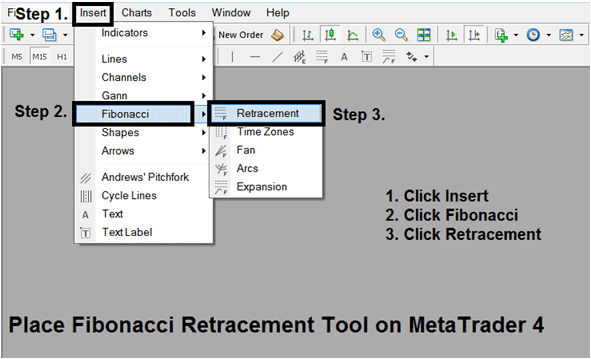
Add this tool to MT4 with this quick shortcut method.
- Click Insert
- Click Fibonacci
- Press Retracement
Once you add the Fibonacci retracement tool to MT4, access it from the Line Studies toolbar as shown here.
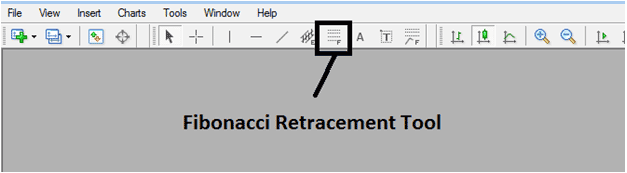
This Fib retracement tool indicator is located on MetaTrader 4 ("Line Studies Toolbar"), to go to this toolbar click "View" at the left top corner of MetaTrader 4 next to file, then click "Tool Bars", Then Check "Line Studies". You can learn how to use Fibonacci retracement tool indicator on the MT4 using a demo demo account.
See the Fibonacci retracement tool example below. Draw it between two points in the gold price trend direction. Label them point 1 and point 2.
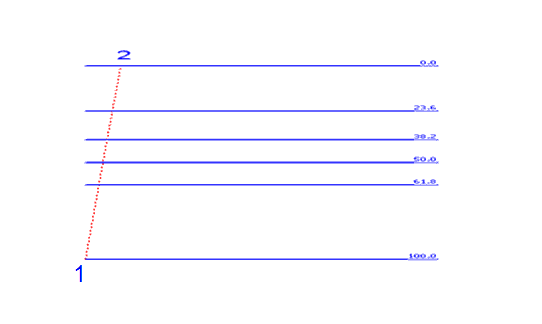
Fib Retracement Levels
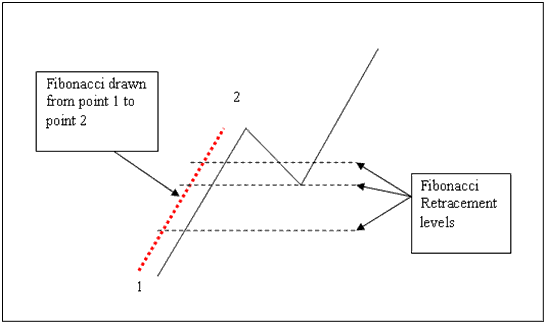
How do you draw Fibonacci retracement between two points?
How to Set Fibonacci Retracement on a XAUUSD Price Chart
Press the button on the MT4 program that is shown above to put this Fibonacci Retracement Levels tool on a price chart. Next, pick two points on the chart: one at the beginning of the trend and one at the start of the trend pullback.
To change this trading tool, just double-click on it and you'll see points show up at locations 1 and 2. Change those points to small squares, click and hold your mouse button to drag these points to the exact spots where you, as a trader, want them to be. You can get some practice with this Fibonacci Retracement Levels tool by using a practice demo account for Gold.
More Lessons:
- What's ECN XAU/USD Account Meaning?
- What's a Gold Inverted Hammer Candlestick in XAUUSD?
- A Manual Lesson on How to Trade XAU USD Price Drops
- How Do You Test MQ5 Automated XAU USD Bots?
- What Steps Do You Take to Sell XAU/USD on MT5 Software?
- Different Types of Traders for XAUUSD
- Day trading strategies for XAU/USD with pivot points and reversal signals reiterated.
- What You Need to Know Leading & Lagging Technical Indicators?
- Dark Cloud Cover Bearish Candlesticks Pattern
- What's the Double Bottoms Chart Pattern When Trading XAUUSD?