How to Draw Fibonacci Expansion Levels on MetaTrader 4 Software Platform
The steps below illustrate how to draw Fibonacci Expansion levels on MetaTrader 4 Software/Platform & how to change its settings. This tutorial also explains how to trade XAUUSD using this tool.
How to Place This Fib Expansion Levels Tool on MT4 Software Platform
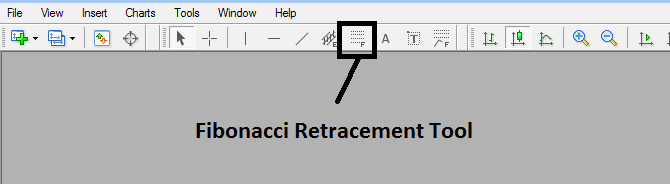
Steps: This tool isn't displayed by default on MT4 default settings, if the button does not appear on your MetaTrader 4, (no need to download this technical indicator) then locate the "MT4 Line Studies Toolbar" shown below and follow the steps outlined below:
MetaTrader 4 Line Studies ToolBar
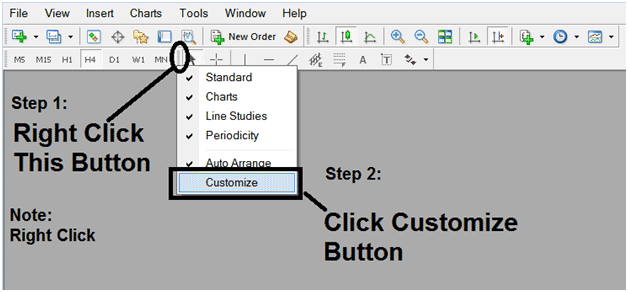
Customize Line Studies ToolBar
Right Click the Customize button (illustrated below) >>> A dropdown menu appears, Select and Choose Customize >>>
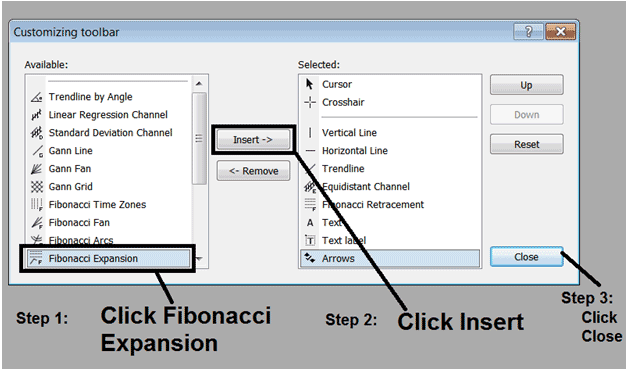
Place This Tool in MetaTrader 4 Platform
Select the extension tool from the pop-up window that then will appear >>> Click Insert button >>> Press Close. (Shown Below)
Fibonacci Expansion Tool Added
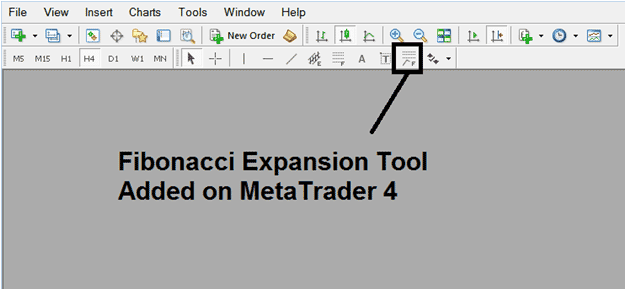
Fibonacci Expansion Levels Tool Added to MT4 Platform Software
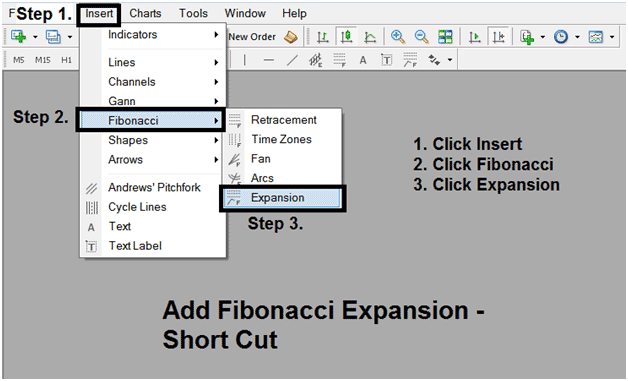
Shortcut of How to Place Fib Expansion Tool
You also can use this short-cut instead of the above method, do this:Press "Insert Menu"Click FibonacciClick Extension
Steps on How to Draw Fib Extension Levels
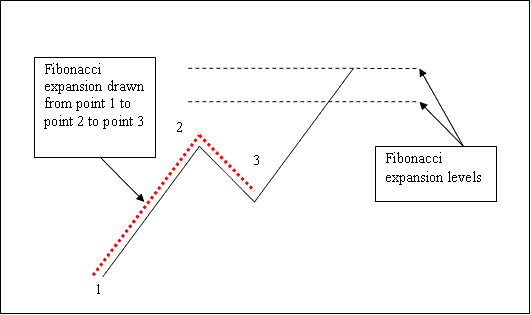
Steps: Once you as a trader have added this Fibonacci expansion button, you can draw this tool by selecting it & drawing it on a XAUUSD price chart. The 3 chart points will be labeled 1, 2 & 3, select the Fibonacci indicator, place the indicator on point 1 and while holding down on the mouse button drag the mouse up to point labeled 2.
How to Draw Fibonacci Expansion Levels on a Gold Price Chart
How to Adjust This Tool on a XAUUSD Chart
Steps: Once you as a trader have drawn this Fibonacci extension indicator, you may need to move one point or another to the exact specific position where you precisely want. These 3 chart points are labeled 1, 2 and 3 & these are used to change the settings after this Fibonacci expansion indicator has been drawn on a Gold price chart.
To change the settings: do this, double click the trading indicator, it appears as dotted lines (illustrated above), three cursor points appear which are labeled 1 2 3, you can then use these 3 points to adjust and fit the indicator accordingly to your price chart (just click on the point you want and move it).
Access More Tutorials and Guides
- XAUUSD Pull Backs Technical Indicator XAU USD Strategies
- How Can I Use XAU USD Price Channel Trading Indicator?
- XAUUSD Average Directional Indices Indicator
- Can I Start XAUUSD with $5000 for Standard XAUUSD Account?
- How to Trade SMA Indicator Buy Forex Trading Signal
- How Do Calculate Profit & Loss in XAUUSD?
- How to Choose and Select Your XAUUSD Style Lesson Tutorial for Different XAUUSD Traders
- How to Open a MT4 Real XAU/USD Account from MetaTrader 4 Platform
- Day Trade Platform/Software Online and Online XAU/USD Platforms
- Periodicity Tool-bar Menu for MT4 Charts


