Drawing Bar Charts in MetaTrader 5 Platform Software
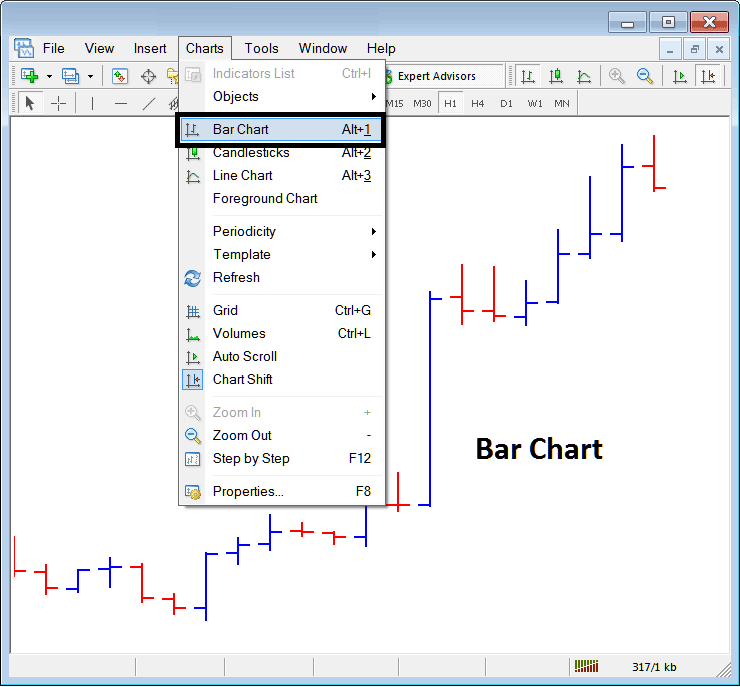
The third chart option in MT5 is the Bar Chart button. It displays price action as bars.

To trade a trader may prefer to use the Bar Charts. The above menu button shows how a trader can select This MT5 option on the MT5 Software Platform.
These are drawn using colour coding:
- Red bar - Price went downwards
- Blue bar - Price went up
In addition, these bars feature horizontal lines on either side that describe the opening (left horizontal dash) and the closing (right horizontal dash).
highest point displays the high of the price
Lowest point displays the low of the price
These four data points - Open, High, Close, and Low - are collectively known as O.H.C.L., an acronym formed from the first letters of these four key price metrics: each bar on the chart will clearly feature these four O H C L zones.
Traders do not favor these charts much. They find them less useful for analysis and prefer other kinds.
Study More Topics & Courses:
- How to Set a Take-Profit Order for XAU/USD on MetaTrader 4 (Android)
- How do you use the Balance of Power (BOP) indicator?
- How to Trade a Coppock Curve Buy Signal in Forex
- How to read XAU/USD chart data from the MT5 window
- The Most Active Overlap Periods in the Gold Market
- Sell XAU USD Signal Rules & Buy Gold Signal System Rules
- Differentiating Between Bar Charts and Gold Charts Tabs in MT4
- How do I start trading on MetaTrader 4?
- What is the Way to Understand the Ehler MESA Adaptive MA Indicator to Know When to Buy and Sell a Forex Signal?
- Guide to Adding the Moving Average Oscillator Gold Indicator to a Trading Chart

