How Many Candlesticks Patterns are There? MetaTrader 4 Software Guide Chart Analysis Lesson Guide
Top 10 Candlesticks Patterns in Gold and their Analysis:
How Do You Read Japanese Candlesticks Patterns? - How to Interpret/Analyze Japanese Candle-sticks Patterns - Study Candles?
Below is a new traders guide on how to read and analyze candles patterns:
Doji MetaTrader 4 Candle Pattern Recognition Lesson
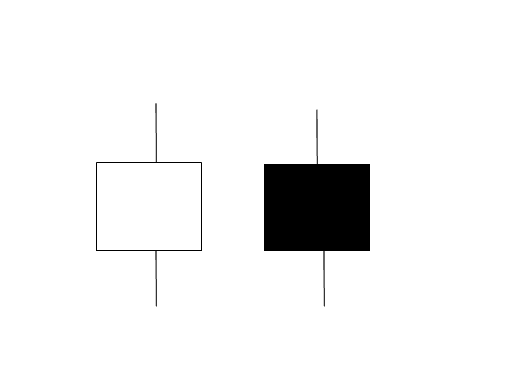
This is a candlesticks set-up with same opening & closing price. There are different types of doji candlesticks setup which form on charts.
following illustrations describe different patterns of the doji candle:
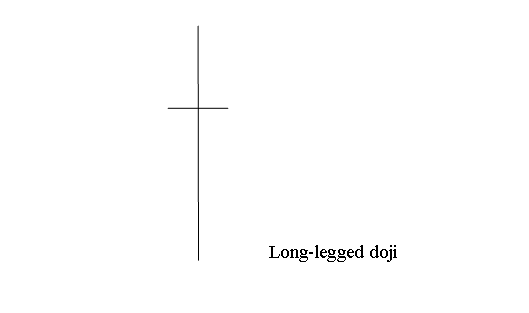
Long-legged doji candlesticks pattern has long upper and lower shadows with the opening & closing price at the mid. When Long legged doji appears on a trading chart it signals indecision between the traders, the buyers(bulls) & the sellers(bears).
Below is example screen shot of the Long Legged Doji xauusd gold trading candles pattern
Doji Pattern - Doji MetaTrader 4 Charts Guide
Doji Pattern - Doji MetaTrader 4 Candlestick Pattern Recognition Lesson
Marubozu MetaTrader 4 Platform Guide Chart Analysis Lesson Guide
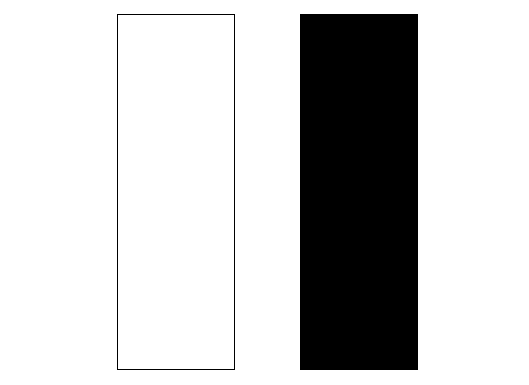
Marubozu candlesticks pattern are long candles which have no upper or lower shadows, Like illustrated below.
Marubozu Candles - Marubozu MT4 Platform Guide Chart Analysis Lesson
Marubozu candlesticks pattern are continuing candle patterns which show price is going to continue in the same direction as that of the marubozu candlestick. The marubozu candlesticks setup pattern can be white/blue or black/red depending on the direction of the trend.
Spinning Tops Candlesticks MetaTrader 4 Platform Guide Chart Analysis Lesson Guide
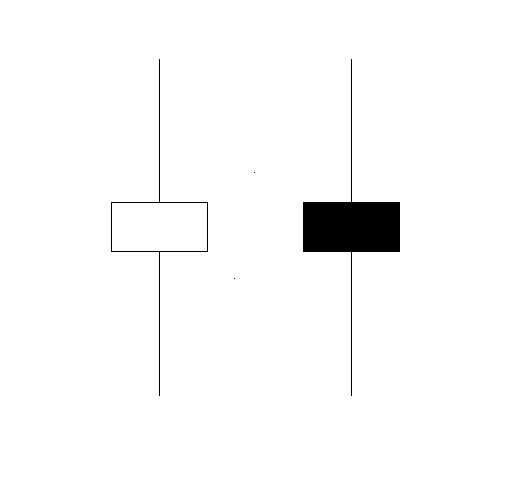
Spinning top candlesticks setup pattern have small body with long upper and lower shadows. The spinning tops candles patterns are referred to by this term because these candles patterns are similar to a spinning top on a match-stick.
The upper & lower shadows of the spinning tops candlesticks set-up are longer than the body. The examples illustrated & explained below shows the spinning tops candlesticks pattern. You can look for the pattern formation in your MetaTrader 4 Software charts. The examples illustrated & illustrated below shows a screenshot to help the Gold traders when it comes to learning and understanding these candles pattern.
How to Interpret/Analyze Candlestick Charts - Spinning Tops MetaTrader 4 Platform Guide Chart Analysis Lesson
Colour of the spinning tops candlestick candlesticks pattern isn't very important, this pattern show the indecision between the buyers & the sellers(bears) in the trading market. When these chart patterns appear at the top of a trend or at the bottom of the price trend it might that the price trend is coming to an end & it might soon reverse & start heading in the other direction. However, it's better to wait for additional confirmation signals that the direction of a market has turned and reversed before trading the trading signal from this candlesticks set-up formation.
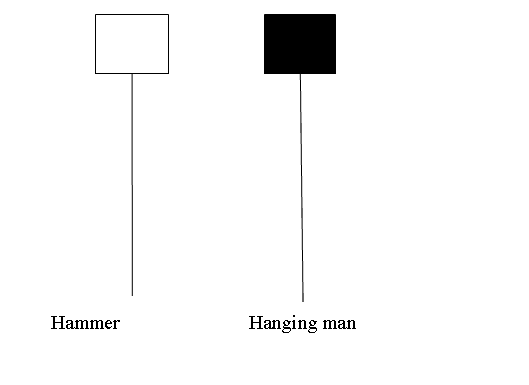
Hammer Candlestick Pattern and Hanging Man Candle MT4 Candlestick Pattern Recognition Lesson Tutorial
Hammer Candle Pattern and Hanging Man Candle candle-sticks look alike & similar but hammer is bullish price reversal candlesticks pattern and hanging man is a bearish price reversalxauusd candlesticks pattern.
Hammer Candle Pattern and Hanging Man Candlestick Pattern - MT4 Platform Guide Chart Analysis Lesson
Hammer Candlestick MetaTrader 4 Software Guide Chart Analysis Lesson Guide
Hammer candles set-up is a potentially bullish candle setup which forms during a downward trend. It's named and called so because the market is hammering out a bottom.
Hanging Man Candle MetaTrader 4 Software Guide Chart Analysis Lesson Guide
This hanging man candles pattern formation is a potentially bearish trading reversal which forms during a upward trend. It's named and called so because it looks like a man dangling on a noose up high.
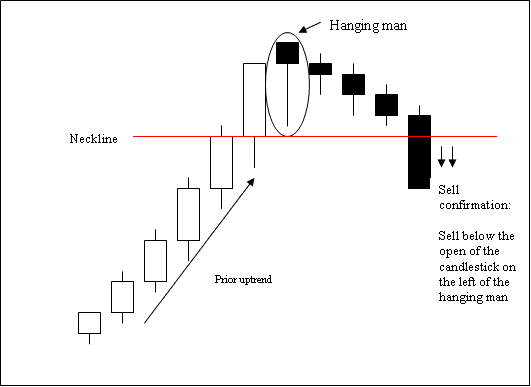
Hanging Man Candle Pattern
Inverted Hammer Candle MetaTrader 4 Software Guide Chart Analysis Lesson Guide
This is a bullish price reversal candlesticks pattern. It occurs at the bottom of a trend.
Inverted hammer candles pattern formation forms at the bottom of a down-trend and signals the possibility of reversal of the downwards trend.
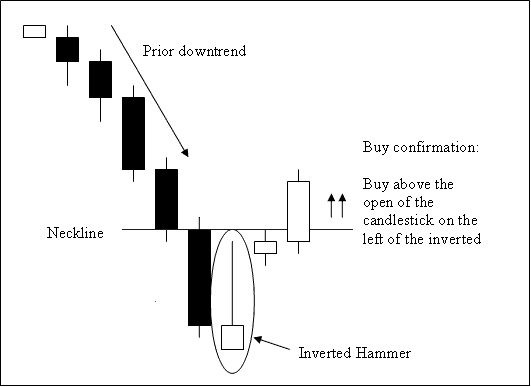
Inverted Hammer Candle Pattern - MT4 Charts Training Course
Shooting Star Candle MetaTrader 4 Platform Guide Chart Analysis Lesson Guide
Shooting Star Candle is a bearish price reversal candlesticks pattern. It occurs at the top of a trend.
Shooting Star candles pattern form at the top of an upward trend in the market where the opening price is same as the low & price then rallied upwards but was pushed & forced back downwards to close near the open.
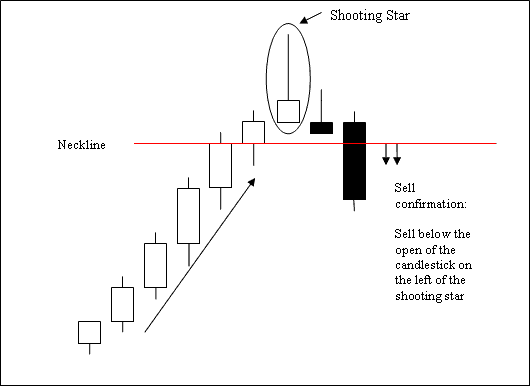
Shooting Star Candle-stick - MT4 Platform Guide Chart Analysis Lesson
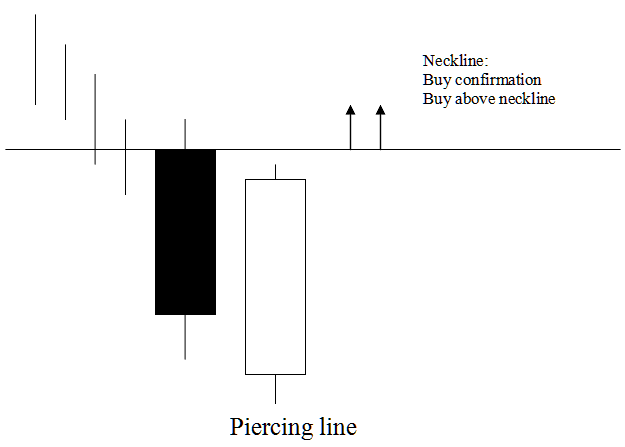
Piercing Line Candle MetaTrader 4 Software Guide Chart Analysis Lesson Guide
Piercing line candlestick pattern is a long black body followed by long white body candle.
The white body pierces the midpoint of the previous black body.
This Piercing Line candles setup pattern is a bullish price reversal candles pattern formation which forms at the bottom of a market downward trend. It shows that the market opens lower & closes above the mid-point of the black body.
This Piercing Line candles pattern formation displays that the force of the down trend is reducing/decreasing and the price trend is likely to reverse & move in an upwards direction.
This Piercing Line candle-sticks pattern is pictured referred to & known as a piercing line signaling that the market is piercing the bottom illustrating a market floor for price downwards trend.
Piercing Line Candle Pattern - MT4 Software Guide Chart Analysis Lesson
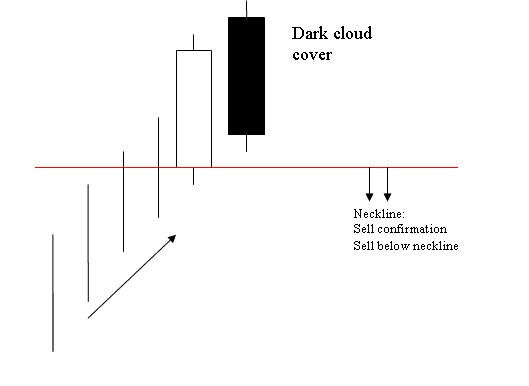
Dark Cloud Cover Candle MetaTrader 4 Platform Guide Chart Analysis Lesson Guide
Opposite of the piercing candle candle.
This candle is a long white body followed by a long black body.
Black body pierces the mid-point of the prior white body.
This is a bearish price reversal trade pattern which forms at the top of an upward trend.
Dark Cloud candlesticks pattern formation displays that the market opens higher & closes below the mid-point of the white body.
Dark Cloud candlesticks pattern displays that the power of the up trend is reducing/decreasing and the price trend is likely to reverse and move in a downward trading direction.
Dark Cloud candlesticks pattern is pictured referred to & known as a cloud cover signaling the cloud as a ceiling for price upwards trend.
Dark Cloud Cover Candle Pattern
Morning Star Candle-stick MT4 Candlestick Pattern Recognition Lesson Tutorial
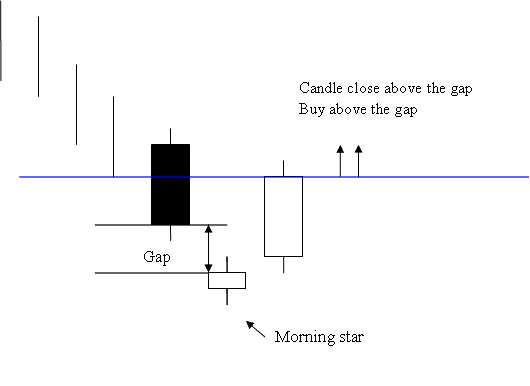
Morning Star Candle Pattern - MT4 Platform Guide Chart Analysis Lesson
Evening Star Candlestick MetaTrader 4 Software Guide Chart Analysis Lesson Guide
Opposite of the morning star candles pattern
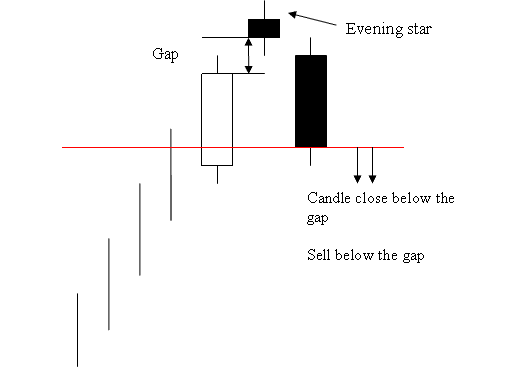
Evening Star Candlestick Pattern - MT4 Platform Guide Chart Analysis Lesson
Engulfing Candles Patterns
Engulfing is a reversal candlesticks pattern which can be bearish or bullish depending upon whether it displays up at the end of a market downwards trend or at the end of a market upwards trend.
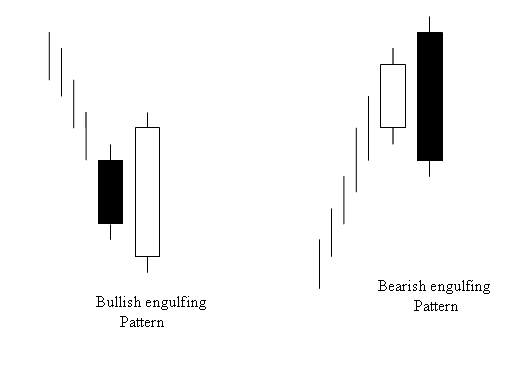
Bullish & Bearish Engulfing Candle-sticks Patterns - MT4 Platform Guide Chart Analysis Lesson
Candle Setups Guide - Candlestick Patterns Tutorial
Get More Tutorials & Topics:
- How to Add Commodity Channel Index, CCI Gold Indicator on Trading Chart
- What is XAU USD Margin Call XAU USD Definition?
- How Do I Read the Trade Market Tutorial Download?
- How Do I Sign in on MetaTrader 5 XAU USD Real XAUUSD Account?
- 1H Candlestick Breakout XAU/USD Strategy
- XAU/USD Platform MT5 XAU USD Platform/Software Setup
- No Nonsense Learn XAU USD Website
- MT5 Bar Charts in MetaTrader 5 Charts Menu
- How Can I Trade MetaTrader 4 Downward XAUUSD Channel in MT4 Platform Software?
- What is TP XAU/USD Order on MT4 Software Platform?


