Inserting Line Studies Tools on the MT4 Platform
The next option on Insert menu within MT4 gold software is Line Studies Button. These tools are used to insert & draw trend lines or to place various technical analysis tools on charts. This button is shown and illustrated below:
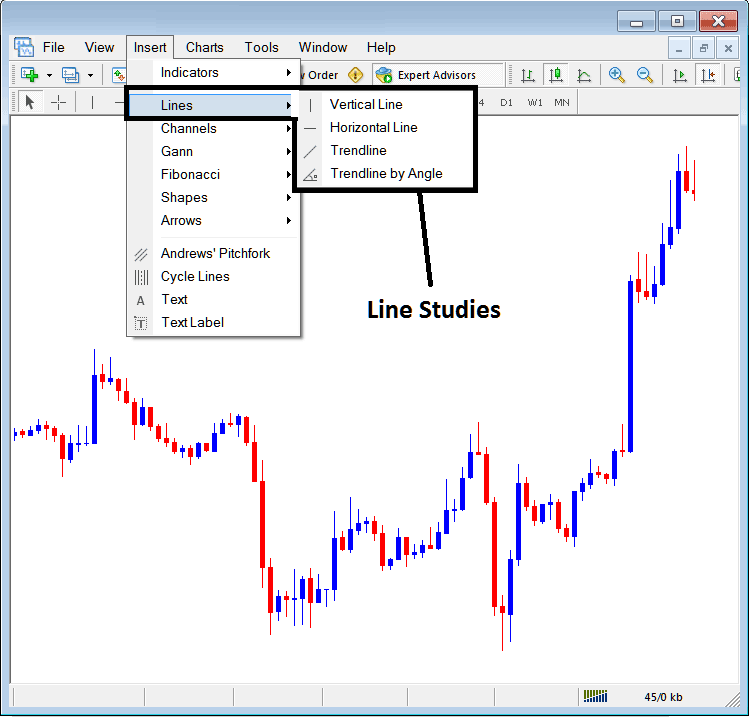
Line Studies on MT4 Platform Software
This button can be used to add the following on charts:
- Vertical Line
- Horizontal Line
- Trend Line
- Trend by Angle
A trader may require to draw any of these line tools on charts for different trading purposes: each line study will be added on the trading chart depending on the type of trading analysis that a gold trader want to achieve.
Vertical Line
This is placed on chart when a trader wants to mark a particular point in a chart, maybe to mark the time they bought gold or sold gold. To place and set this vertical line in chart, a trader will open the insert menu, such as illustrated and shown above, then click on the "Vertical Line" option - to choose this, the cursor will also change to explain vertical line icon & then select and choose the point on the chart where you want to draw this line.
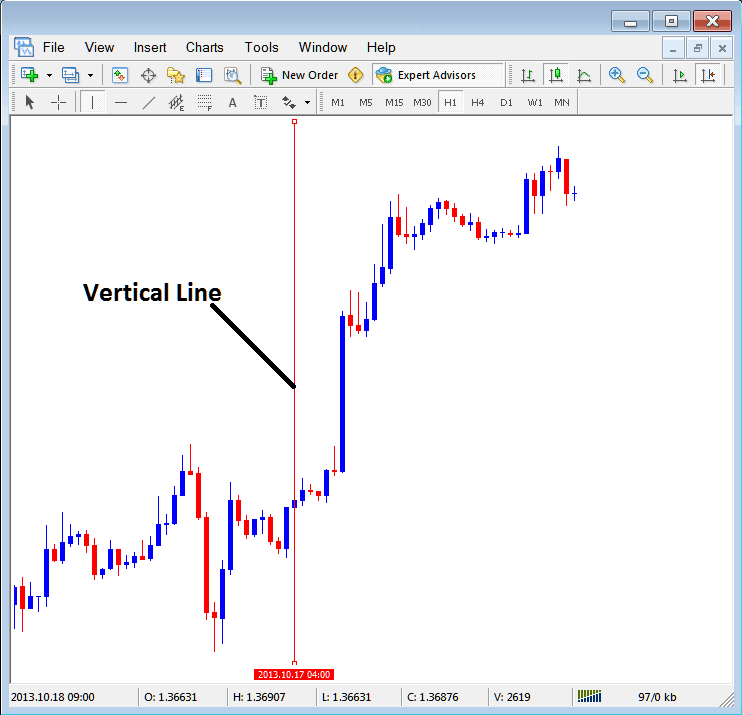
Insert a Vertical To a Chart in the MT4
Horizontal Line
On MT4 trade platform, this line is placed on chart so as to mark a resistance zone or a support level on the chart. The horizontal line can be drawn by selecting its button key within the insert menu and then pressing on the level where you as a trader want to place it.
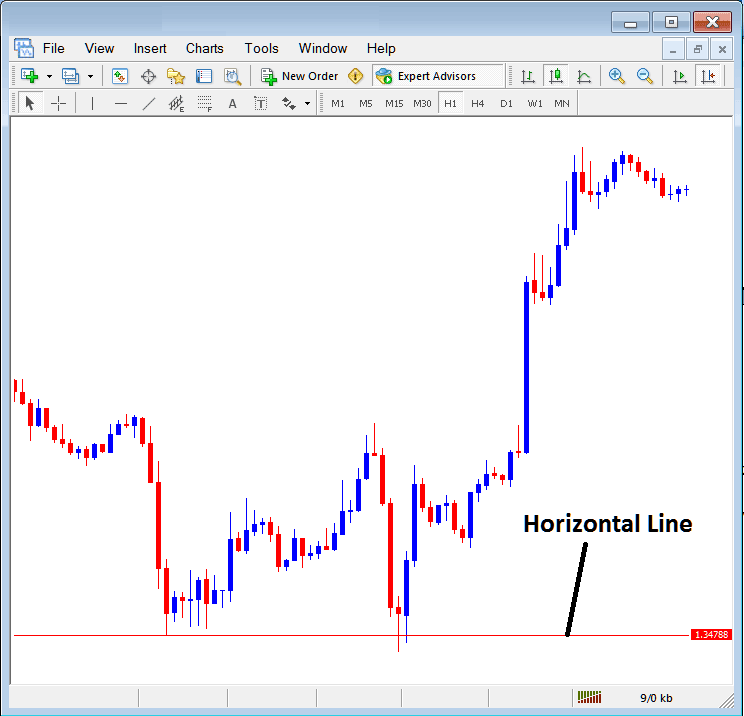
Drawing a Horizontal Line on MT4 Platform Software
On the trading example above this horizontal line is drawn at price support level, the price bounces up the second time that it gets to this point. Trend then changes to upward trend direction.
Trend Line
This is one of most oftenly used technical analysis tool in gold trading. To draw this trend-line one can access this button from the insert menu. An upwards trend line on MetaTrader 4 is illustrated and shown below.
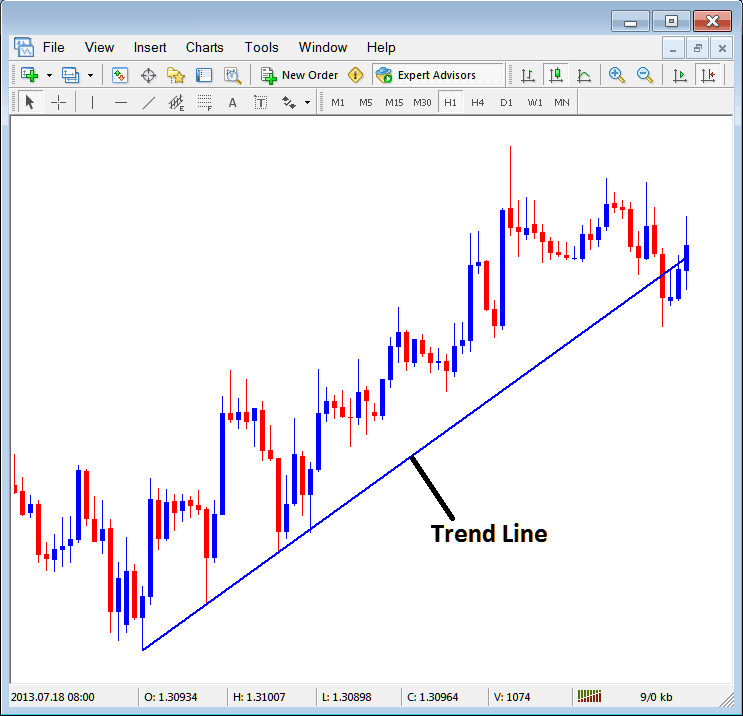
Trend-Line Drawn on the MT4 Platform
To draw a trend line one has to have 2 points and join these points with the trend line & then extend it as illustrated and shown above.
One can draw this trendline for either an upward trend direction or downwards trend direction
Trend Line by Angle
The next option is to draw a market trend by angle, this one looks exactly like the ordinary trend line displayed above, only that in addition it will show the angle at which the trend line is slanting which many trade transactions might use as a signal and specify to only trade if the angle is more than 30 degrees.
Customizing
As a trader you may want to change the formatting of a particular item for examples let use "Trendline" study, if you want to edit its properties then you can choose it by double clicking on it, then right click on it and the following menu will show.
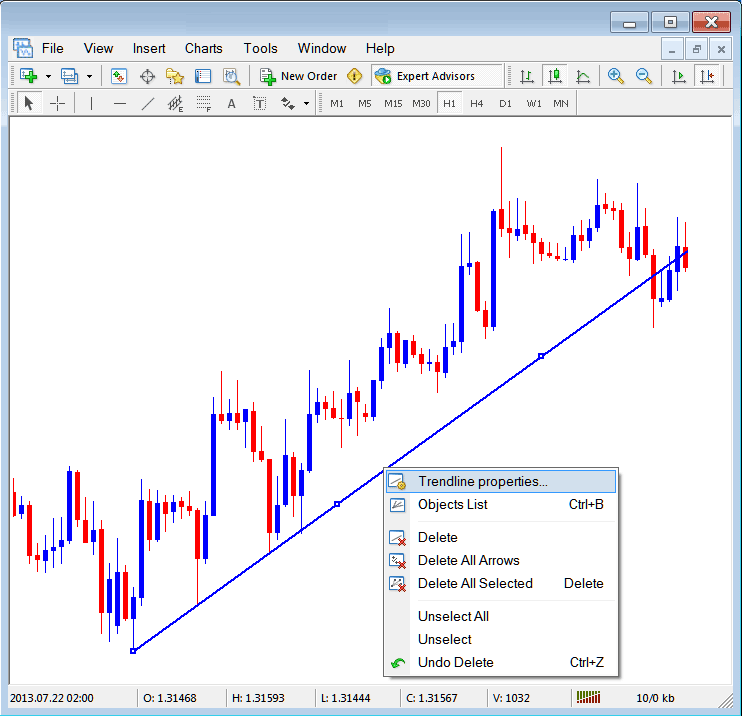
Changing
Common Properties
After the above menu appears (Note the trend line has 3 square points that you can click and drag with the mouse to adjust it to another point using these three squares), select the first option only "Trendline Properties", the following pop up panel will popup.
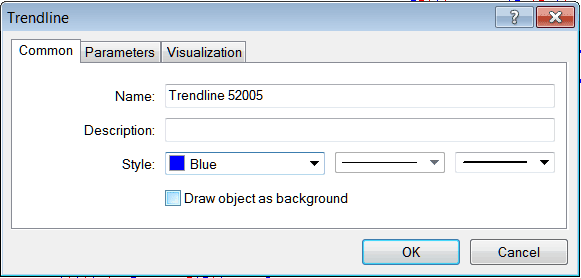
From this menu one can rename the trendline, give it a description, change the style color to another color using the down arrow next to the color named "Blue" above or change the width property by selecting a different style from the 2 drop down arrow buttons next to the colour button, and then choose okay.
The other options are marked & tagged 'Parameters' and 'Visualization'
Parameters
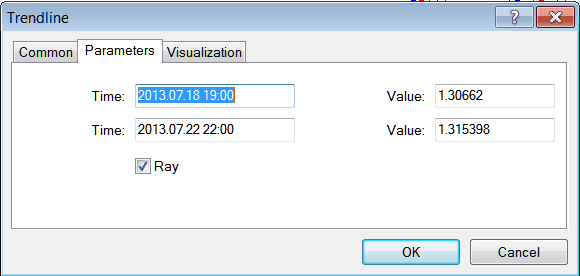
On the parameter, tick/untick the choice/option marked and labeled as 'Ray', this will extend/unextend the trend line upto the point where you have selected. Download MetaTrader software to learn what this we are talking about.
Visualization
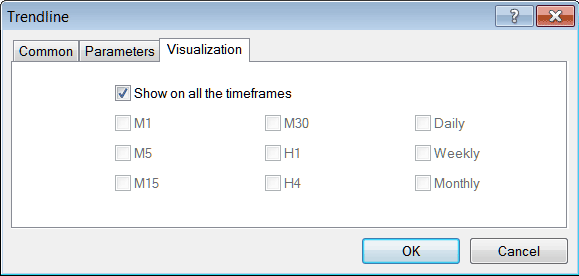
Visualization is used to select whether the line is illustrated on all time-frames or only shown on a choose few timeframes that a trader can select & select from this option just as shown below.
Customizing Tools MetaTrader 4 Studies
Learn More Tutorials & Guides:
- Gold Software MT5 Opening an Offline Chart in MetaTrader 5 Platform Software
- How do you use the MT5 gold software? Here's a guide.
- Open Charts List Window of Open Charts in MT4 Platform
- How to Add ADX XAU USD Indicator in Chart in MetaTrader 4 Platform
- How Do I Set TakeProfit XAU USD Order in MetaTrader 5 iPhone Trading App?
- What You Need to Know Leading & Lagging Indicators?
- An Introductory Tutorial Guide for Using the MetaTrader 5 Course on Android Devices

