How Do I Interpret a Technical Chart?
To analyze charts traders should learn the 2 analysis used to analyze price movement on charts. These two analysis are:
Japanese Candle Sticks Charts Analysis
Gold Setups Analysis
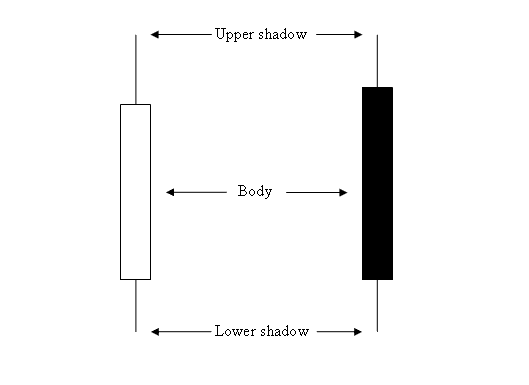
- Japanese Candlesticks - Study of a single candlestick - Japanese Candles Technical Analysis
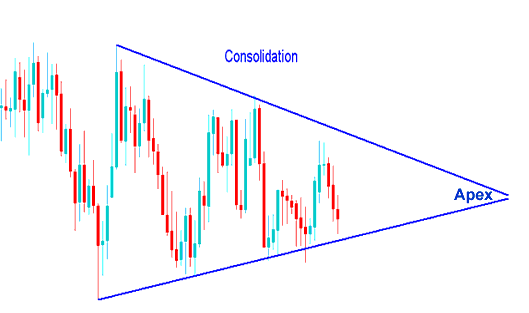
- Gold Setups - Study of a series of candles formations in gold trading
The different lessons for these two types of analysis are:
Learn Japanese Candles Technical Analysis Guides
Patterns Technical Analysis Tutorials
The chart example below also illustrate the difference of the arrangements of these two analysis techniques.
Candles Charts - Study of a single candle trading analysis

Candlesticks Charts - Study of a single candlestick trading analysis
Chart Patterns - Study of a series of candlesticks technical analysis

Chart Patterns - Study of a series of candlesticks technical analysis
Get More Topics and Courses:
- How to Trade a XAUUSD Price Pullback
- What is the Interpretation of XAU USD Charts?
- True Strength Technical Indicator TSI Indicator MT4 Platform
- Best XAU/USD Platforms for Beginners
- Best Training Tutorial Lessons & Trading Training Courses
- How to Create a Moving Average MA XAU/USD System
- How to Calculate Required Gold Margin


