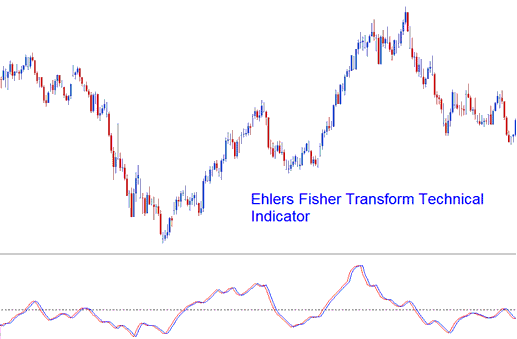
Ehler Fisher Transform Analysis and Ehlers Fisher Transform Trading Signals
Created by John Ehler,
Started as a Tool for Stocks and Commodities.
The Ehler Fisher Transform shows two lines: the Fisher line and the signal line. Crossovers between them create signals, much like the stochastic oscillator.
It was made to find big price changes using quick response time and clear turning spots, making it a leading sign.
This indicator assumes prices don't follow a normal bell curve. It normalizes price data with the Fisher Transform. That creates lines close to a Gaussian shape.

Ehler Fisher Transform
Analysis and Generating Signals
You can get very accurate trading signals by watching where the Fisher Transform and its signal line cross each other.
The Ehlers Fisher Transform lacks precision. Like other leading tools, it sends false alerts and whipsaws often. Pair it with other indicators for best results.
Learn More Tutorials:
- Guide Tutorial Price Action Strategies Lesson Guide
- Learn XAU USD Analysis for Beginners
- MT4 Kauffman Efficiency Ratio XAU USD Indicator
- How Can I Read Where to Place XAU USD Stop Loss using Parabolic SAR XAU/USD Indicator?
- Meaning of Bullish Reversal Chart Trade Pattern
- RSI Classic Bullish XAUUSD Divergence vs RSI Classic Bearish XAUUSD Divergence
- How to Set a Symbol in the MetaTrader 5
- Learn XAU/USD Tips for Successful Trade
- Setting the Alligator Gold indicator on trading charts in MetaTrader 4.
- Daily Risk Management Strategies specifically for XAU USD Trading

