ADX Momentum Gold Breakout Indicator Technical Analysis and DX Momentum Trading Strategies Signals
ADX is a momentum technical indicator used to trade gold - ADX Momentum Breakout Indicator.
ADX Momentum Breakout Indicator is used to measure the strength of gold market trends on a scale of 0 - 100; the higher the ADX Momentum value the stronger the current xauusd trend. It should be noted that while the direction of the xauusd price is important to the ADX Momentum indicator calculation, the ADX Momentum indicator itself is not a directional gold indicator. ADX Momentum Gold Indicator values above 30 indicate a very strong gold trending market, while ADX Momentum Gold Indicator values below 20 indicate non-trending gold market or a ranging xauusd market.
Traders use the ADX technical indicator as a filter along with other technical indicators to create XAUUSD ADX Momentum Trading Strategy.
Many traders interpret ADX momentum indicator zones turning up from below 20 as an early signal of a new emerging gold trend break out signal - while declining ADX indicator levels turning down from above 30 as a reversal of the current xauusd trend.
ADX Momentum technical indicator should be used as part of a gold trading system that includes the +DI & -DI lines. Most gold trading platforms integrate the original ADX Gold Indicator with the +DI and -DI indicators -DMI Index and collectively refer to the whole gold indicator system as the ADX Momentum Gold Technical Indicator.
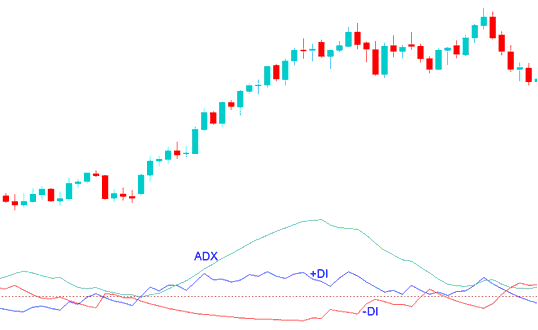
In the ADX indicator example illustrated and explained below:
ADX Momentum Gold Indicator is the light green line
+DI is the blue-line - bullish line
- DI is the red-line - bearish line
ADX Gold Strategy That Works - ADX False Breakout Indicator MT4
Bullish Gold Trend - when the +DI, blueline is above the -DI, red-line
Bearish Gold Trend - when the -DI, red line is above the +DI, blue line
ADX Momentum Strategies PDF
A bullish gold signal is generated when the +DI line is above -DI line, when blue line is moving above red line.
To identify a strong bullish ADX Momentum Break out trading signal we wait until the ADX Momentum technical indicator values move above 20, & the blue line is above the red-line. This is a bullish ADX Momentum Breakout signal because the DMI system identifies the gold signal as a buy, while ADX Momentum indicator levels above 20 shows there is a strong upward momentum xauusd trend.
ADX Momentum Strategies PDF
A bearish trading signal is generated when redline is above the blue line i.e. -DI line is above the +DI line. A strong short signal will be generated when this bearish trading signal is accompanied by an ADX Momentum value of above 20.
To identify a strong bearish ADX Momentum Breakout trading signal we wait until the ADX Momentum technical indicator values move above 20, & the redline is above the blue-line. This is a bearish ADX Momentum Break out signal because the DMI system identifies the gold signal as a sell, while ADX Momentum indicator levels above 20 shows there is a strong downwards momentum xauusd trend.


