Types of Energies Trading Moving Averages
There are four types of energies moving averages:
- Simple energies moving average
- Exponential energies moving average
- Smoothed energies moving average
- Linear weighted energies moving average
The difference between these 4 energies moving averages is the weight assigned in to the most recent price data.
Simple Moving Average
Energies Trading SMA indicator applies equal weight to the energies data used to calculate the simple moving average and is calculated by summing up the price periods of a chart and this value is then divided by the number of such price periods. For example energies simple moving average 10, adds the price data for the last 10 price periods and divides them by 10.
Exponential Moving Average
Energies Trading EMA indicator applies more weight to the most recent price data and is calculated by assigning the latest price values more weight based on a percent P, multiplier that is used to multiply and assign more weight to the latest price data.
Linear Weighted Moving Average
Energies Trading LWMA indicator moving averages applies more weight to the most recent price data and the latest data is of more value than earlier price data. Linear Weighted energies moving average is calculated by multiplying each of the energies closing prices within the series, by a certain weight coefficient.
Smoothed Moving Average
Energies Trading SMMA Indicator is calculated by applying a smoothing factor of N, the smoothing factor is composed of N smoothing for N price periods.
The chart example highlighted & described below displays SMA, EMA and LWMA. The SMMA energies moving average is not commonly used so it is not shown below.
The LWMA indicator reacts fastest to price data, followed by the EMA and then the SMA.
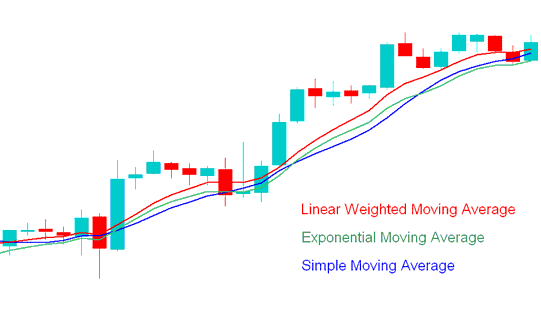
SMA, LWMA, EMA - Types of Energies Trading Moving Averages - SMA, EMA and LWMA

Day Energies Trading with Exponential and Simple Moving Averages
The SMA and EMA energies moving averages are the most commonly used Moving averages to trade energies. Whereas the EMA energies moving average has a more sophisticated method of calculation, its more popular than the SMA energies moving average.
Simple Moving Average is the arithmetic mean of the closing prices in the price period based on the set time period where each time period is added and then it is divided by the number of time price periods chosen. If 10 is the price period used the price for the last ten price periods added up then it is divided by 10.
SMA indicator is the result of a simple arithmetic average. Very simple and some traders tend to associate with the trend since it closely follows price action.
EMA on the other hand uses an acceleration factor and it is more responsive to the trend.
The SMA energies moving average is used in charts to analyze price action. If the price action in more than 3 or 4 time price periods the SMA then it's an indication that long trades should be closed immediately and the bullish momentum of the buy trade is waning.
The shorter the SMA price period the faster it is to respond to price change. SMA indicator can be used to show direct information regarding the trend of the market and the strength by looking at its slope, the steeper or more pronounced slope of the SMA is, the stronger the trend.
The Exponential Moving Average is also used by many traders in the same way but it reacts faster to the market moves and therefore it is more preferred by some traders.
The SMA and EMA can also be used to generate entry and exit points when energies. These Moving averages can also be combined with Fibonacci and ADX indicators to generate confirmation the signals generated by these moving averages.
What is a Trading Plan? - Writing a Trading Plan Example
Alternatives: EA Automated Robots or Copier Trading Signals

