Bollinger Bands Indicator and Price Volatility
When price volatility is high; prices close far away from the moving average, the commodity Bollinger Bands width increases to accommodate more possible price action movement that can fall within 95 % of the mean.
Bollinger bands indicator will widen as commodities price volatility widens. This will show as bollinger band bulges around the price. When the commodity bollinger bands widen like this it is a continuation commodity pattern and commodities price will continue moving in this direction. This is normally a continuation signal.
The Bollinger bands indicator example illustrated and explained below illustrates the Bollinger bulge.
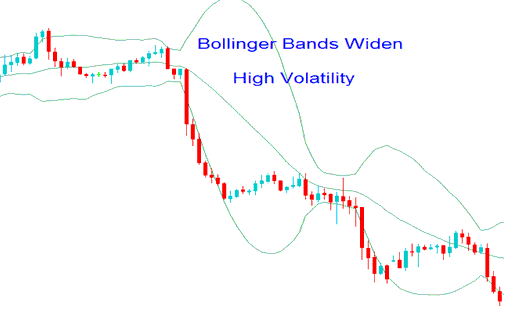
High Price Volatility - Commodity Bollinger Bands Indicator - Bollinger Band Bulge
When price volatility is low: prices close closer towards the moving average, the width decreases to reduce the possible price action movement that can fall within 95 % of the mean.
When price volatility is low commodities price will start to consolidate waiting for price to breakout. When the commodity bollinger bands indicator is moving sideways it is best to stay on the sidelines and not to place any trades.
The Bollinger bands indicator examples is shown below when the commodity bollinger bands narrowed.
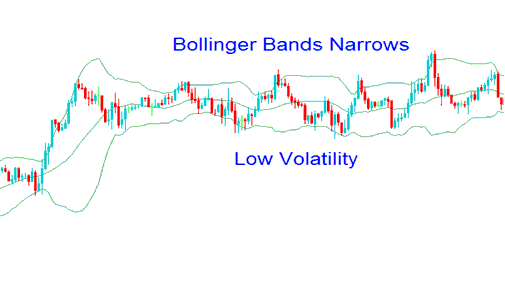
Low Price Volatility - Commodity Trading Bollinger Bands Indicator - Bollinger Bands Squeeze
What is a Trading Plan? - Writing a Trading Plan Example
Alternatives: EA Automated Robots or Copier Trading Signals