Upward Trendlines & Channels
An upwards trend line is plotted below the cfd trend pattern by connecting at least 2 lows. This upward trend line will draw a line that show the general direction of the market.
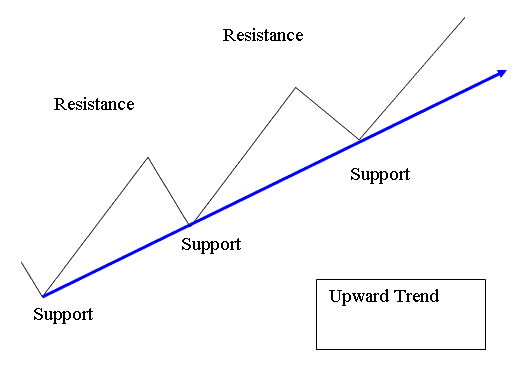
The diagram below shows how price moves when it is moving in a bullish market. The price will move upward forming support zones.
Since the cfd market moves in a zigzag manner traders normally draw a cfd trend line which portrays the general upward direction of the market.
A cfd up trend occurs when the fore price will continue making consecutive higher highs and higher lows. Each price high being higher than the previous high - higher high, and each low is higher than the previous low - higher low.
CFD Trading Up cfd trend lines gain more validity every time price touches this upward trend line but does not penetrate it. A cfd up trend remains in place until this sequence of higher highs and higher lows is broken.
A down-side penetration of an upwards trendline is a technical sell cfd signal, and usually the first indication that an upwards trend may soon end.
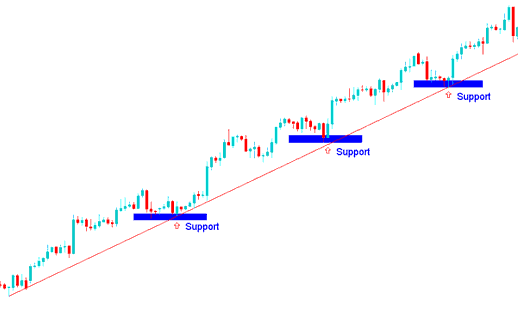
Upward Trend Line MT4 CFD Trend Line Indicator
When the cfd market moves up it forms higher highs and higher lows forming a bullish market movement - Upward Trend. An upward trend line can then be drawn by connecting these higher lows.
To draw this upwards trend line setup we use supports. To draw the upward trend line correctly two support levels are needed. When price touches the upward trend line we buy and place stop loss orders just a few pips below the upward trend line. The diagram below shows an example of an upward trend line.

The cfd upward trendline setup will show the general direction of the market as bullish therefore cfd traders will only open buy long trades as long as price is within this upward trend bullish market setup and within the support areas. These support levels are the levels where if the cfd market retraces then these points will provide strong supports for the price. This is why many cfd buyers will wait until price retraces downwards & hits these retracements levels market the upward trend line to open buy trades. CFD trades opened at this support levels have a high Risk to Reward Ratio with minimum draw down.
In the above upwards trend line cfd setup the trader would have opened buy/long trades from the signals generated at the support1, support2, support3 and these trades would have made a lot of profits with minimum amount of draw-down/retracement.
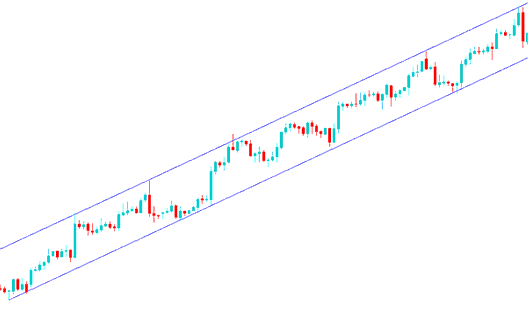
Upward CFDs Trading Channel
An upwards cfd channel is plotted by plotting a line that's parallel to the upward trend line and then adjusted to touch the tops boundary of the price movement. This then forms an upwards cfd channel & as long as the price stays between these two trend channels the bullish upward market movement will continue heading upwards.
How to Trade Upward CFD Channel
This upwards cfd channel is used by traders to show levels where it is best to take profits. CFD traders will take some profit once the price touches the upper channel and wait for another retracement before opening a long buy trade again.
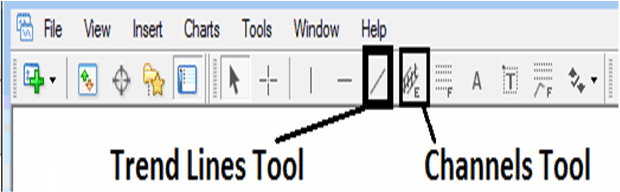
MT4 Tools For Drawing Trendlines & Channels
The CFD MT4 Trend Line Indicator drawing tools to draw these cfd trend lines & cfd channels setups on the MT4 are located on the MT4 drawing tool bar within the MT4 platform, To get this MT4 tool bar if it is not activated on your platform, Click in "View" Next to the "File" menu at top left corner of MetaTrader 4 platform & click View, Then Press on Tool-Bars, Then Check "Lines Tool-Bar" by clicking on it.
Below is the screenshot Image of the MetaTrader 4 drawing tool bar. To draw a cfd trendline on a cfd chart click on this MT4 cfd trend line drawing tool and select the point where you want to draw the cfd trend line.
This is one of the learn cfd analysis lesson among the many learn cfd tutorials on this website located on the side navigation menu, where you will learn how to draw trend lines & analyze these cfd trend lines setups.
What is a Trading Plan? - Writing a Trading Plan Example
Alternatives: EA Automated Robots or Copier Trading Signals