Spinning Tops Candlesticks Pattern and Dojis CFDs Candle Setups
Spinning Tops CFDs Candlestick Patterns
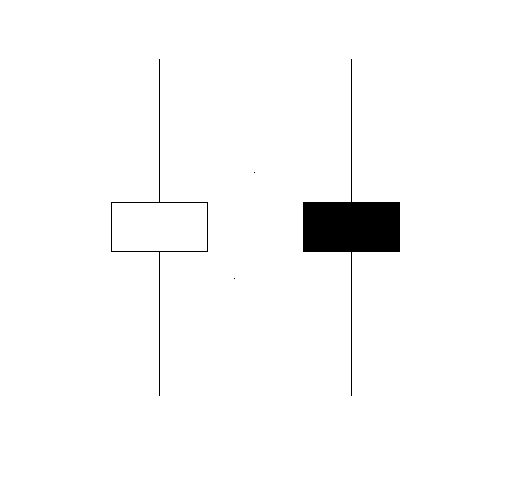
Spinning tops candle-sticks pattern have a small body with long upper and lower shadows. These spinning top are referred to by this name of spinning top because they are similar to spinning top on a matchstick.
The upper and lower shadows of the spinning tops are longer than the body. The example illustrated and shown below shows spinning top pattern. You can look for setup in your MetaTrader 4 Platform charts. The example illustrated & shown below shows a screen-shot to help traders when it comes to learning and understanding these formations.
How to read candlestick charts - Spinning Tops
The color of spinning top candle is not very important, this formation show the indecision between the buyers & sellers in the market. When these patterns appear at the top of a trend or at the bottom of the trend it might signify that the trend is coming to an end and it may soon reverse and start going the other direction. However, it is better to wait for confirmation signals that the direction of a trend has reversed before trading the signal from the chart formation.
Candle Reversal Patterns Formations on Charts
At the top of an up-wards trend a black/red spinning top shows that a reversal is more likely than when the color of the candle is white/blue.
At the bottom of a CFD Trading downward trend a white/blue spinning top shows that a reversal is more likely than when the color is black/red.
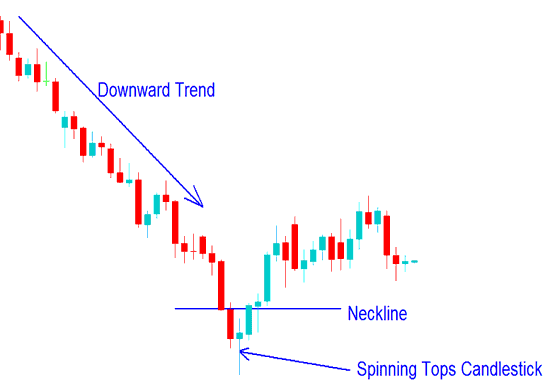
This reversal signal is confirmed when the next candlestick pattern that forms after the spinning tops closes below the neckline for a downward trend reversal signal confirmation, and closes above the neckline for a reversal signal in a downwards trend.
The neckline is:
- For an Upward Trend - The open of the previous candlestick that was drawn just before the spinning top.
- For a Downwards Trend - The open of the previous candlestick that was drawn just before the spinning top
Shown Below is example of this Japanese charting techniques where this pattern has formed & how to trade it. On the chart below when the price moved above the neckline the reversal signal given by the spinning top candlestick was confirmed and this was a good point to exit the short sell cfds trade.
Spinning Top Pattern on a Chart
Color of spinning tops formed is blue therefore meaning that a reversal was more likely as opposed to if the color had been red.

Doji Candlesticks Pattern
This is a pattern with same opening and closing cfds price. There are various types of doji candle patterns that form on charts.
following examples show various patterns of the doji candlestick:
Long-legged doji candle has long upper and lower shadows with the opening and closing cfds price at the middle. When Long-legged doji pops up on a CFD Trading chart it indicates indecision between cfds traders, the buyer and the sellers.
Shown Below is example image image of the Long Legged
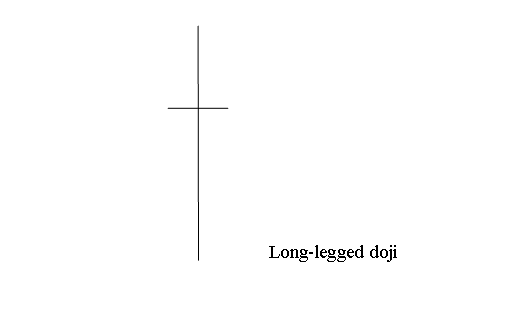
- Doji cfds trading chart pattern
Cross Doji Candle
Cross doji has a long lower shadow & a short upper shadow and the open & close of the day is the same.
This pattern appears at market turning points & warns of a possible trend reversal in the market. Shown Below is as example of this chart formation
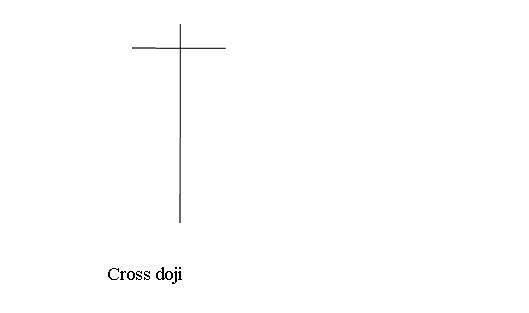
- Cross Doji Pattern
Inverted Cross Doji CFDs Candle
Inverted cross doji candlesticks have a long upper shadow & a short lower shadow and the open & close is the same.
This reversal pattern appears at market turning points & warns of a possible trend reversal in the market. Shown Below is an example
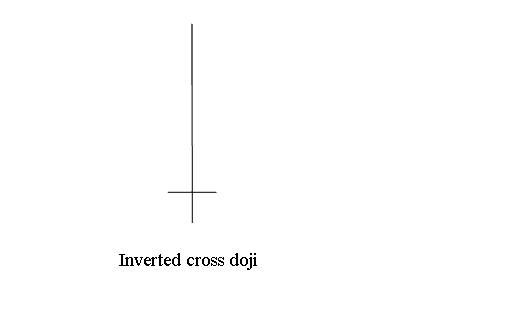
- Inverted Cross doji
Technical Analysis in CFDs Trading - All doji candles pattern show indecision in the market this is because at the top of the buyers were in control, at the bottom the sellers were in control but none of them could gain control & at the close of the market the price closed unchanged at the same price as the opening cfds price. This doji shows that the overall cfds price movement for that day was zero pips or just a minimum range of 1-3 pips. Reading these charts patterns require very small pip movement between the opening cfds price and closing cfds price.
What is a Trading Plan? - Writing a Trading Plan Example
Alternatives: EA Automated Robots or Copier Trading Signals