Dark Cloud Cover Candle Pattern
Piercing Line Bullish Candlestick Patterns
A Piercing Line CFD Candle Pattern & Dark Cloud Cover Candle Pattern look alike but the difference is that one occurs at the top of a CFD Trading up cfd trend (Cloud Cover) and the other occurs at the bottom of a downwards trend (Piercing).
Upward Trend Reversal - Dark Cloud Cover Candles
Downward Trend Reversal - Piercing Line Candlesticks
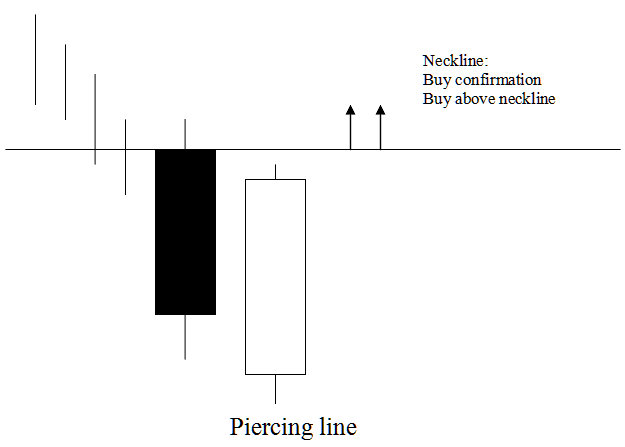
Piercing Line Candlestick
Piercing line is a long black body followed by a long white body candlestick.
The white body pierces the mid point of the prior black body.
This is a bullish reversal pattern that occurs at the bottom of a market downward trend. It shows that the cfd market opens lower and closes above the midpoint of the black body.
This displays that the momentum of the down cfd trend is reducing & cfd market trend is likely to reverse and move in an up-wards direction.
This pattern is shown referred to as a piercing line signifying the cfd market is piercing the bottoms showing a market floor for the price downward trend.
Piercing Line Candle
Technical Analysis Piercing Line Candle
A buy signal is confirmed once price closes above the neck line region which is the opening of the candlestick on the left side of the Piercing Line candle.
This is a bullish setup and price should continue moving up-wards & for a trader who puts a buy trade should also place a stop loss order just below the lowest price region.

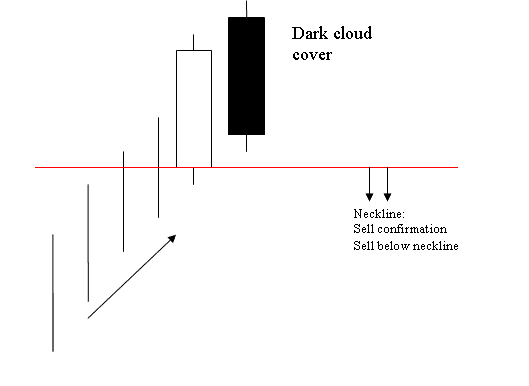
Dark Cloud Cover Candlestick
Opposite of piercing candle.
This candle is a long white body followed by a long black body.
Black body pierces the midpoint of the prior white body.
This is a bearish reversal pattern that forms at the tops of an upwards trend.
It shows that the cfd market opens higher and closes below the midpoint of the white body.
This displays that the momentum of the up cfd trend is reducing & cfd market trend is likely to reverse & move in a downwards direction.
This pattern is shown known as a cloud cover signifying the cloud as a ceiling for the price upwards trend.
Dark Cloud Cover Candlestick
Technical Analysis Dark Cloud Cover Candle
A sell signal is confirmed once price closes below neckline which is the opening of the candle on the left of this candlestick.
This is a bearish setup and price should continue moving down-wards & for a trader who puts a sell trade should also put a stop loss order just above the highest price region.
What is a Trading Plan? - Writing a Trading Plan Example
Alternatives: EA Automated Robots or Copier Trading Signals