Linear Regression Technical Analysis & Linear Regression Signals
Another name for a regression line is a line of the best fit/best fit line. This indicator plots the cfd trend of the price over a specified duration of time. The market trend is determined by calculating a Linear Regression Trend Line using the "least squares fit" method. This method helps to minimize the distance between the price data points and the line of best fit.
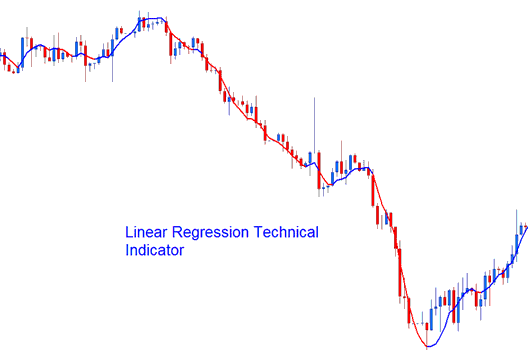
Unlike the straight Regression Trendline indicator, the indicator draws the end values of multiple Linear Regression trend lines. Any single point along the Linear Regression will be equal to the end value of a Regression Trend Line, but resulting trendline looks like the Moving Average.
But unlike the Moving Average, this indicator does not show as much delay since it's fitting a line onto data points rather than averaging them.
The Linear Regression is a prediction of the tomorrow's price drawn today, one day before. When the cfd prices are steadily higher or lower than the forecast price, then a trader can expect them to quickly return to more realistic fore-casted levels.
In other terms, this indicator shows where the chart prices "should" be trading based on a statistical basis and any disproportionate deviation from the regression line is likely to be short-lived.
CFDs Analysis & Generating CFDs Signals
This indicator allows for price selection, adjusting number of periods and smoothing of price data before applying the calculation and the selection of smoothing type.
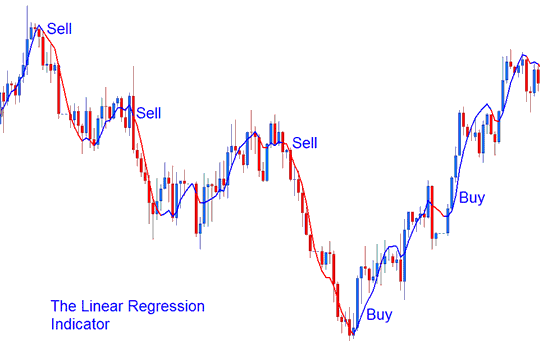
This indicator looks like a moving average but it has a bi-color representation.
- Bullish Signal (Blue color) - A rising line (greater than its previous value 1 previous bar before) is displayed in the up cfd trend blue color, while
- Bearish Signal (Red color) - a declining line (lower than its previous value 1 previous bar before) is displayed in the down trend red color.
Technical Analysis in CFDs Trading
What is a Trading Plan? - Writing a Trading Plan Example
Alternatives: EA Automated Robots or Copier Trading Signals