RSI Indicator Patterns & CFD Trend Lines
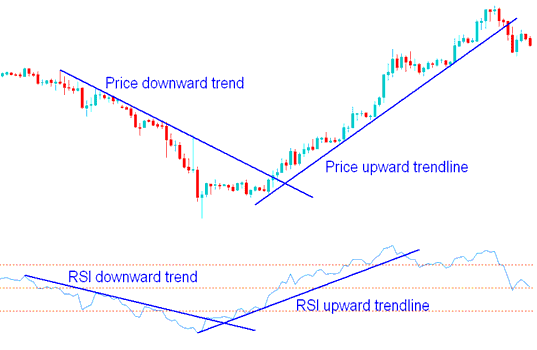
Traders can draw trend lines on the RSI in the same way as you can draw trend lines on the price charts. RSI trend lines are drawn the same way cfd trend lines are drawn on the chart; by joining consecutive highs of the RSI indicator or consecutive lows on the RSI Indicator.

RSI CFD Trendlines & CFD Trend lines on Charts
RSI Chart Patterns in CFDs Trading
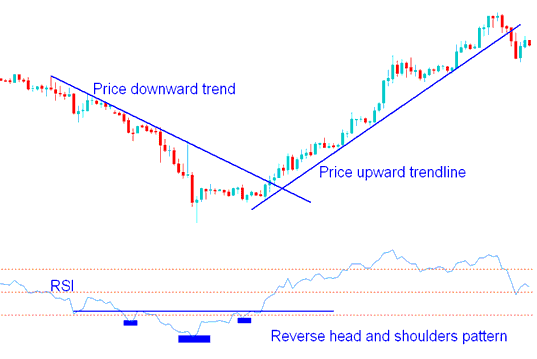
RSI Chart patterns such as head and shoulders patterns or triangle cfd chart patterns that are not evident on the price chart are often formed on this RSI indicator.
RSI indicator also often forms patterns such as head & shoulders or triangles chart patterns that may or may not be visible on the price chart. As shown on the chart below the Reverse Head and Shoulders reversal formation is clearly shown on this cfd RSI indicator.

Chart Patterns on RSI Chart Technical Indicator
Support & Resistance Levels Trading using RSI Indicator
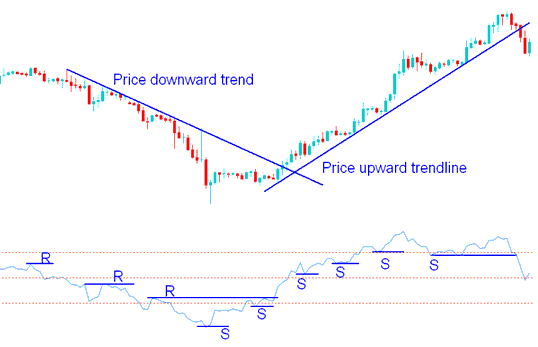
Sometimes chart levels of support and resistance levels are demonstrated better on the RSI indicator than on the price chart.
In an upward market trend the support levels should not be broken at any one time, if they are broken then price will also break the support levels & the upward trend is going to reverse.
In a downward trend the resistance levels should not be broken, if they are broken then price will also break the resistance levels, and the downward trend is going to reverse.

Support & Resistance Areas on RSI Indicator
In the cfd example above when the third resistance level was broken the downward trend reversed to an upward trend and when the sixth support was broken the upward market cfd trend reversed and broke the upward trend line.


