Average True Range ATR CFD Analysis and ATR Signals
Developed by J. Welles Wilder
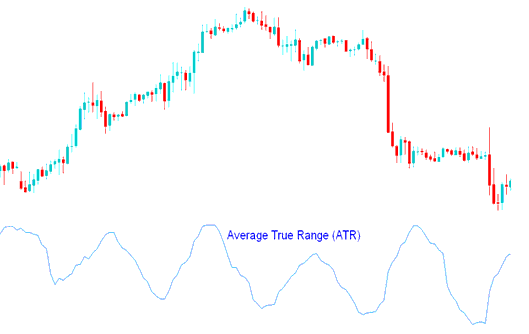
This indicator is a measure of volatility - it measures the range of price movement for a particular price period. The ATR is a directionless indicator and it does not determine the direction of the trend.
High ATR values
High Average True Range indicator values indicated market bottom after a sell off.
Low ATR values
Low Average True Range values showed extended periods of sideways cfds price movement- Price Range, such as those found at market tops and consolidation periods. Low ATR values are typical for the periods of sideways movement of long duration which happen at the top of the cfd market and during consolidation.
Calculation
This indicator is calculated using the following:
- Difference between the current high and the current low
- Difference between the previous closing price & the current high
- Difference between the previous closing price & the current low
The final Average is calculated by adding these values and calculating the average.
Technical Analysis and Generating CFDs Signals
Average True Range indicator can be interpreted using the same principles as other volatility technical indicators.
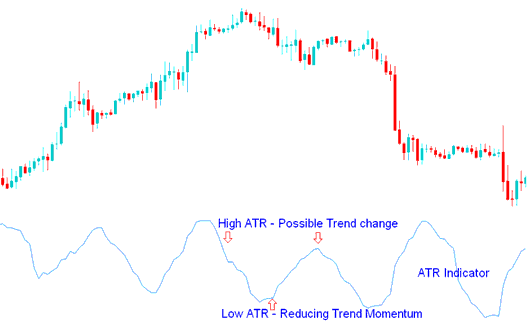
Possible cfd trend change signal - The higher the value of the indicator, the higher the probability of a trend change;
Measure of cfd trend momentum - The lower the indicator's value, the weaker the cfd trend movement.
Analysis in CFDs Trading
What is a Trading Plan? - Writing a Trading Plan Example
Alternatives: EA Automated Robots or Copier Trading Signals