Support & Resistance Zones in Gold Trading
Support and resistance levels rank among the top tools for online gold trading. Traders also apply them to forex pairs, stock indexes, and other commodities.
Support and resistance on XAUUSD charts block gold prices from breaking past certain levels in one direction.
Support Level
As its designation implies, this technical level provides backing to the price, preventing it from dropping past a specific value.
A support level stops XAUUSD price from falling below it. It acts as a base for gold prices, blocking further drops.
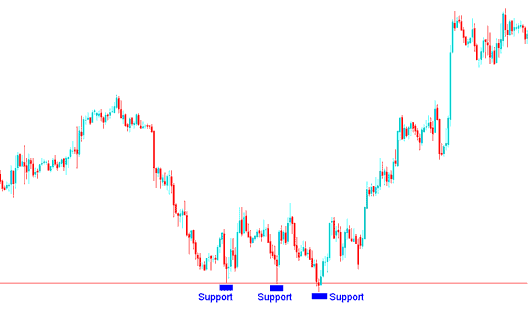
Support Zone
On the above illustration the price moved down until it hit a support area. Once price touches/tests this technical level it slightly bounced back up and then resumed going downward again until it hit the support level & bounced up again.
This process of hitting the support level and then bouncing back is called testing the support.
The more frequently a support level is tested, the more robust it becomes. In the example above, the support level withstood three tests without being breached, after which the market's downward trend eventually reversed, leading to an upward movement.
Once this critical level has been identified on the XAUUSD trading chart, traders utilize it as the location to place their buy orders, simultaneously setting a stop loss order just a few pips below this identified technical level.
Resistance Level
A resistance level represents a price ceiling that impedes Gold's upward movement beyond a specific valuation. Consequently, this boundary acts as a cap on the price, preventing it from advancing further past that designated point.
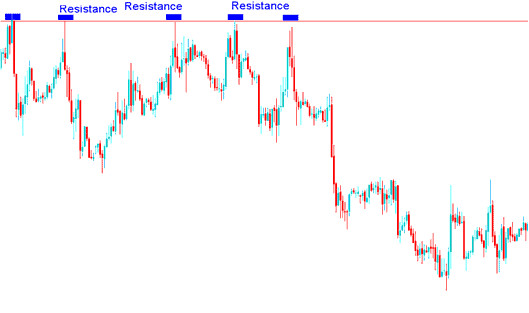
Resistance Zone
On the example shown above the price moved up until it hit a resistance area. Once the price hit this level it retraced and then resumed heading up until it hit the resistance level again.
The area of resistance was tested five times without failing: the more a level of resistance is tested without a break, the stronger that level becomes.
After identifying a resistance area, traders commonly place sell orders at this level while setting a stop-loss order a few pips above the resistance threshold.
<<
Explore Further Subject Areas:
- Chandes Q-Stick XAUUSD Indicator Study for Trading
- XAU USD Hanging Man Candle Breakdown
- Introduction to XAUUSD Market Basic Concepts for Beginner Traders
- Navigating Candlestick Menu in MT4 Platform for Chart Setup Basics
- How to Trade XAU/USD Using Trend Channels in MT4
- How Can You Set XAUUSD CCI Technical Indicator in Chart?
- What Does 1:1 Leverage Mean in Gold Trading?
- Trading XAU/USD Charts on the MT4 Gold Platform
- How to Place Moving Average MA Oscillator XAU USD Indicator on Chart


