Momentum Trends - Trade Parabolic Price Trends
What is a momentum trend? It shows more force than the last trend. You draw a sharper line for this new one than before. A steeper line means the market picks up speed and gets stronger. These patterns call for unique technical checks.
In the illustration shown below: Also when the price is moving upward within a channel, if it breaks the upwards channel a stronger trend is formed like illustrated in the diagram below. If as a trader your price chart breaks an upward trend-line to the up-side in an upwards moving market like the one below, Don't Try to Sell, Buy More Contracts, Remember this XAUUSD trading tip it can make you a lot of money just like the way it did in the market analysis below.
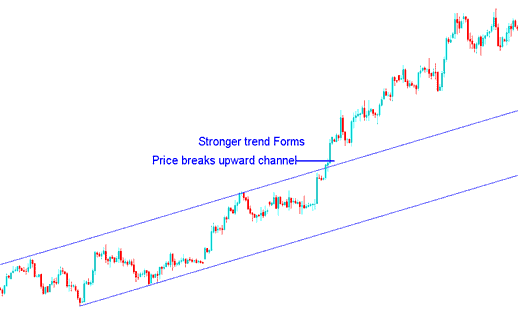
Momentum Price Trend - Channel Break Upward - Enhanced Momentum in an Upward Trending Market
Using the same technical analysis example from before, we can also see how steeper trend-lines formed, which showed that the trend was getting stronger.
Steeper trend lines appear as price action builds.
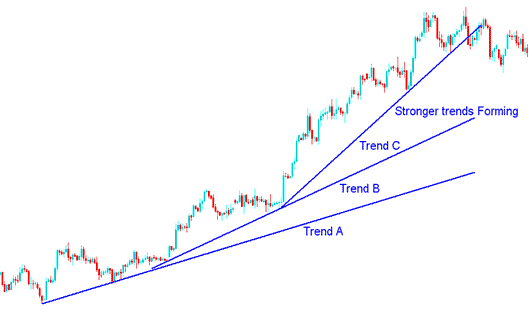
The new upwards trend is stronger than the one before, as shown by how the steeper trend-line is set up.
This new trend forms trend B and C just as illustrated in the diagram below drawn using the MT4 trading analysis software, the momentum added a new steeper trend-line as drawn on the price chart.
This is shown in the example below by the three lines A, B, and C, which show how stronger trends form as the market price keeps building up its energy.
XAUUSD Price Gaining More Upward Momentum
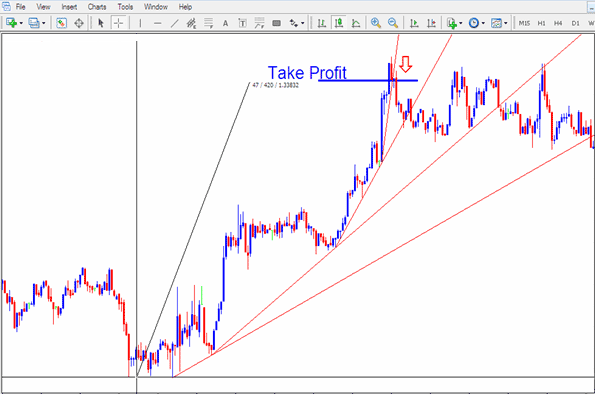
However, when the steepest trend-line is broken then even all the others will most likely be broken too. It's best to take-profit once the steep most trend-line is broken.
This trading strategy also can be used by short term Gold traders like the day traders or the scalpers, this pattern will frequently form on the 5 minute and 15 minute Gold price chart. These parabolic trend-lines can be used to know where to set take profit order. One should immediately take his profit as soon as the steepest most line is broken.
How Do I Trade These Momentum Price Trends Setups
The momentum trend lines are good tools for figuring out where to take your profit early, before other traders. This way of trading based on momentum happens often on 1-minute, 5-minute, and 15-minute charts, so it works for scalpers and day traders. For intraday trading, which is most common, the best chart time frame to use is usually 15 minutes, sometimes 5 minutes. For example, if you enter a short-term trade, either a buy or sell, and the market moves some pips in your favor, and you see this pattern, then it is best to exit once the steepest line is broken and take your profit there.
Technical Analysis Example
For this case, we'll use a 5-minute chart to draw the setup. When it formed as shown, it was a solid spot to take profits.
the Momentum Market Moves
In the preceding visual example, a trader holding a long position would have elected to close their purchase trade immediately after the steepest trend-line was breached, thereby locking in a profit for that buy transaction. By exiting at that precise moment, the trader secured optimal timing and successfully avoided the subsequent market period characterized by sideways price oscillation.
Parabolic Trends - What is it?
Prices sometimes climb in a steep curve when fear drives buys. Gold shoots up fast with few sellers around. This buying rush leaves gaps. Traders jump in at any price to avoid missing out. Such moves create big swings in little time. In this pattern, buyers keep adding orders without pause.
For this sort of move it's far satisfactory to maintain buying - no want for technical evaluation simply hold shopping for.
Sometimes, a trend just keeps going for months, maybe even a couple of years. As long as those weekly and monthly trend lines hold, just keep buying.
When stock, currency pair, or gold prices climb to a peak, it often ends the up move. Prices rarely return to that high for a long time. Once the sharpest trendline breaks at that point, view it as a reversal. Step back from the market then. Take your profits and plan the next step.
A parallel scenario can arise during a downtrend marked by panic selling, which drives prices sharply lower. This is particularly common during economic downturns when commodity prices consistently decline.
The sharper the angle of a trend line, the less dependable it becomes. If such a steep trend line breaks, it's advisable to close any ongoing buy transactions. The diagram below demonstrates this concept using an oil trade chart with a parabolic setup.
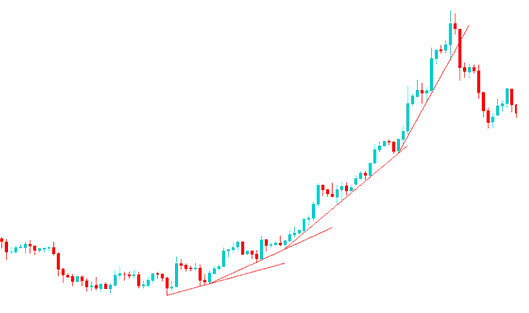
Parabolic Price Trend
In an uptrending market with a parabolic rise, keep buying. Profits pile up fast. No need for deep analysis beyond trendlines. Exit when the steepest trendline breaks. Reversals hit quick, so act fast. Time your exit right, like in the example above.
Shown as an illustration, the preceding parabolic movement originates from a crude oil trading chart. Traders managed to push the price of crude oil from $70 to $150 across a span of a couple of months. At the apex of this movement, individuals posing as market analysts were so optimistic that they forecast crude oil reaching an all-time high of $200. These analysts were unaware of this market phenomenon known as a parabolic trend, or 'Vacuum Buying.' In standard market analysis, while trend lines indicated an upward direction, even after the first significant incline was broken, the analysts maintained their insistence that the price would reach $200. Consider the result: after the most extreme trend-line was violated, the oil price didn't even require two weeks to fall back to $50: it briefly hit $35. That is the nature of parabolic trading analysis: now you understand.
Another example of parabolic price move is Gold that formed on the weekly/monthly trading chart during the same period shortly after the steepest trend line on the oil trade chart was broken. You can open the XAUUSD Gold chart and use the Weekly & Monthly chart time-frames to try and spot these parabolic trend setup of XAUUSD Gold prices.
Good examples of this setup on charts is the weekly & monthly price charts for XAUUSD & Crude Oil, these charts can be found on MetaTrader 4 platform/software depending on your broker.
Learn More Lessons:
- Regulated MetaTrader XAUUSD Broker Data
- How Can I Make a Gold Plan?
- Understanding Moving Average MA Whipsaws in Range Bound Markets: Gold Methods
- Indicator Analysis of ROC (Rate of Change) for XAU USD on XAU USD Charts
- How to Change Where to Cash Out XAU USD on MT5 Program


