Japanese Candlesticks Patterns
Japanese Candlesticks were developed in the 18th century by Homma Munehisa, a renowned rice trader. They were designed to provide a visual representation of market data, including opening, high, low, and closing prices over a specific time interval.
Candlestick charts were employed by a renowned rice trader to forecast future prices. After achieving significant success in the rice market, Munehisa transitioned to the Tokyo exchanges, amassing considerable wealth through this candlestick analysis. It is reported that he executed more than 100 successful trades in a row.
Types of XAUUSD Charts
Three types of charts exist used in XAUUSD charts: Line charts, bar charts & candles charts.
Line charts
Line charts use a continuous line that connects the closing prices of a XAUUSD, Gold metal to make the chart.
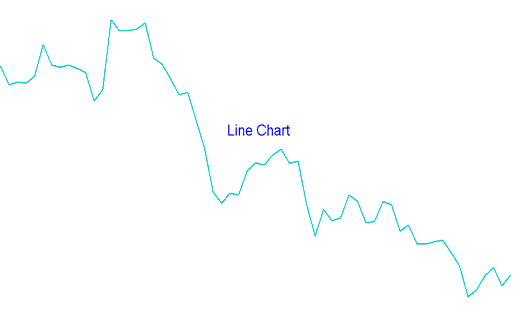
XAUUSD Line Chart
Bar Charts
Bar charts - bar charts are shown as series of OHCL bars. O.H.C.L. represents OPEN HIGH LOW and CLOSE price. Opening price is displayed as a horizontal hyphen to the left and the closing price is portrayed as a horizontal hyphen to the right.
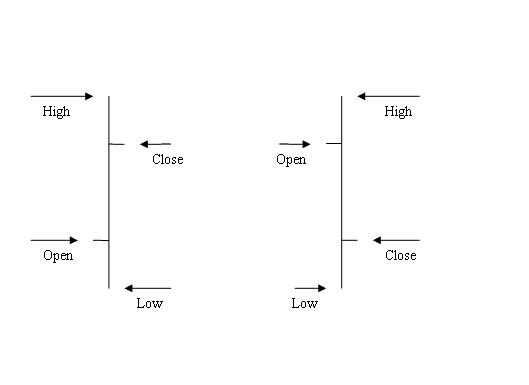
XAUUSD Bar Charts
The main disadvantage of bar charts is that they are not visually appealing: therefore most Gold traders don't use these trade charts.
Candle Charts
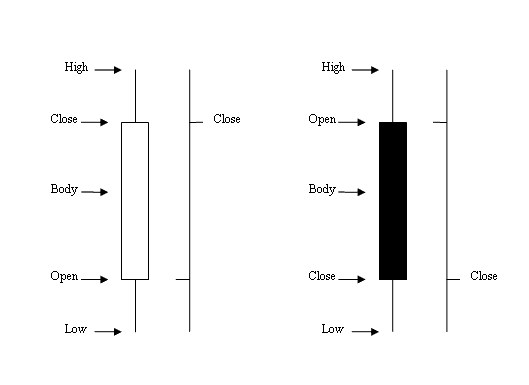
Candlestick Charts - These charts utilize the identical price components as bar charts (the opening, high, low, and closing prices). However, they present this information in a more visually engaging format, resembling a candle complete with wicks on both extremities.
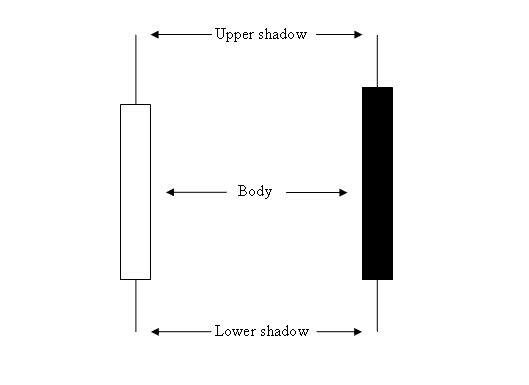
XAUUSD Candlesticks Charts
How to Analyze Japanese Candlesticks Charts
The rectangle part is called the body of the candlestick.
The high and low are referred to as shadows & plotted as poking lines. The color may be either blue or red
- (Blue or Green Color) - Shows prices moved up
- (Red Color) - Shows prices moved down
Platforms like MetaTrader 4 color candlesticks to show direction. Green or blue means price rises. Red means it falls.
Using candlestick charts makes it considerably easier to ascertain the direction of price movement (up or down) compared to when bar charts are employed.
Gold Candles Charts vs Bar Charts
The Japanese candlesticks charting methods also have many trade formations which are used by technical analysts to trade the XAUUSD Metal. These candle patterns have different trading analysis interpretation & the most regular Japanese candlesticks patterns are:
- Marubozu and Doji candlesticks
- Spinning Tops candlesticks
- Reversal Patterns candlesticks
- Inverted Hammer and Shooting Star candlesticks
- Piercing Line and Dark Cloud candlesticks
- Morning Star and Evening Star candlesticks
The aforementioned Japanese Candlestick patterns contribute to the popularity of this charting method among technical analysts, making it a preferred approach for evaluating gold prices. The analysis for these candlestick formations in XAUUSD trading mirrors that of stock and Forex trading.
Creating Candle Charts in MetaTrader 4
To put these candlestick charts on the MT4 software, find the chart drawing options within the "MT4 Tool Bar" area as shown in the image here.
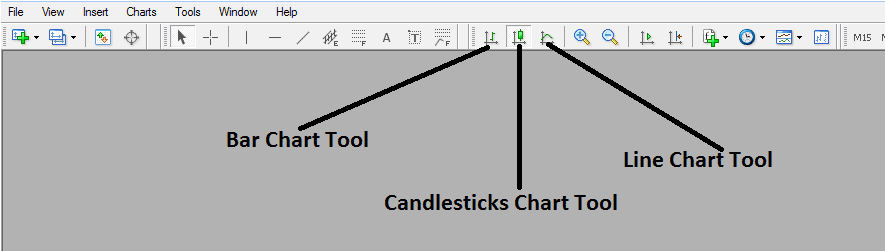
MetaTrader 4 Charts Drawing ToolBar
To see the chart tool bar in MT4, go to "View" which is beside file on the top-left part of the MetaTrader 4 Program, Select "View", and Choose "ToolBars", Then select the "Charts" Button. You will then be able to see the tool bar.
When the chart toolbar shows up, pick the type you want. For bars, click the bar button as shown. For lines, hit the line button. For candlesticks, select the candlestick button.
More Subjects and Online Classes:
- Can I Trade XAUUSD Without Using XAUUSD Leverage?
- XAUUSD Support and Resistance for XAU/USD
- How to Trade XAU USD with a Gold Standard Account
- XAUUSD Define a Gold Trend on XAU/USD Charts
- How to Calculate Leverage and Margin in XAU USD XAU/USD
- How to Gold Trade: New XAUUSD Trader Wanting to Start XAUUSD
- Technical Analysis Bears Power Indicator Buy Forex Trading Signal
- How to Modify a Stop Loss Gold Order on MetaTrader 5 Software
- How to Use TP XAU/USD Orders & Use Stop Loss Gold Order on MT4 Platform Software
- Which XAU/USD trend reversal indicator works best?


