Techniques for Trading Classic Bullish Divergence and Bearish Divergence Patterns
In XAU/USD trades, classic divergence signals a potential trend reversal. Gold traders use it to spot reversal zones. This setup offers low-risk entries. It also provides precise exits from open XAUUSD positions.
This well-known divergence strategy is a safe way to sell close to the highest price or buy near the lowest price, so the risk on your trades is very small compared to what you could gain. But, this method often gives false signals & most traders advise against using it.
Classic divergence trading setup in XAUUSD Gold trading also is used to predict the optimum point/level at which to exit an opened trade transaction. If you already have an executed position that is already profitable, a good way to identify a profit taking level would be the point where you spot this divergence trading setup.
Two Classic Divergence Types Depend on Gold Price Direction
- Classic Bullish Divergence Trading Setup
- Classic Bearish Divergence Setup
Classic Bullish Divergence
The classic formation for a bullish divergence trading setup occurs when the asset's price registers successively lower lows (LL), yet the associated indicator shows a pattern of successively higher lows (HL). The ensuing illustration provides a visual representation of this classic divergence scenario.
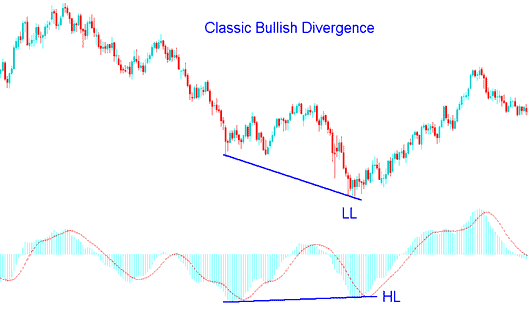
Classic Bullish Divergence Trading Setup - Gold Chart
The example above uses MACD indicator as the divergence trading indicator.
When the price forms a lower low (LL) while the indicator creates a higher low (HL), it signals a divergence between the XAUUSD price action and the indicator. This setup suggests a possible reversal in market trend direction.
Classic bullish divergence trading signal warns of a possible change in the XAUUSD price trend from downward to upwards. This is because though the price headed higher lower the volume of sellers which moved price lower was less than before when you compare and analyze the 2 lows - like is shown by the MACD technical indicator.
This shows underlying weakness of the downwards XAUUSD trend.
Classic Bearish Divergence
A classic bearish divergence happens when price hits a higher high, but the oscillator shows a lower high. The example below shows this setup.
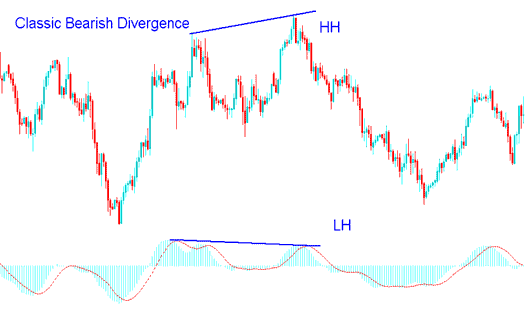
Classic Bearish Divergence Trading Setup - Gold Chart
The above example also uses MACD indicator
In this case, the price hit a higher high. But the indicator showed a lower high. That points to divergence between XAUUSD price and the tool. It hints at a trend shift ahead.
Classic bearish divergence trading signal warns of a possible change in the Gold price trend from upward to downwards. This is because even though price moved higher higher the volume of buyers(bulls) that moved price higher was less just as is illustrated by MACD.
This specific formation reveals the underlying fragility within the prevailing upward momentum observed in the XAUUSD market.
Looking at the examples shown earlier, if you had traded using typical divergence setups, you would have received helpful clues for entering or exiting trades at the best times. But, just like other clues, divergence trading clues can sometimes lead to false moves. That's why it is always a good idea to check divergence trading clues using other clues like RSI, MAs Moving Averages & Stochastic Oscillator Technical before starting a trade.
A beneficial indicator to pair with a classic divergence trading setup is the stochastic oscillator: one should then await the stochastic indicator lines to shift in alignment with the divergence indication for verification of the signal.
Another valuable technical indicator to integrate with this particular setup is the moving average indicator: for this, a XAUUSD gold trader should utilize the MA Cross-over System to confirm signals derived from the divergence trading setup.
Example illustration of Moving Average MA Crossover Method
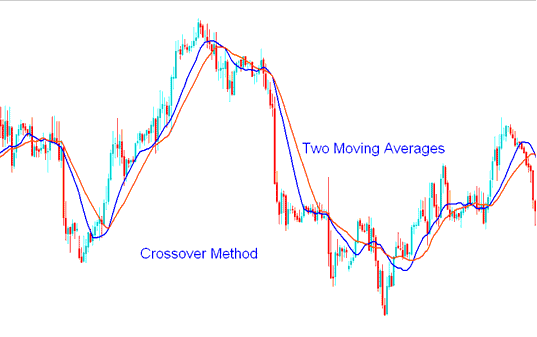
MA Cross over Trading Method Combined with Classic Divergence Setup
After the divergence signal for trading shows up, a trader then waits for the Moving Average crossover method to give a trading signal in the same direction, if there is a normal bullish divergence signal, a trader then waits for the moving average crossover method to give a signal going upwards, but if it's a bearish divergence signal the trader should wait for the Moving average crossover to give a signal going downwards.
By combining the classic divergence signals with other indicators this way, a trader will be able to avoid whipsaws when it comes to trading the classic divergence trading signals, because the trader will wait until the market has actually reversed and is already moving towards the generated signal direction - hence the trader will not fall into the trap of picking the market tops and market bottoms by entering transactions before the actual divergence trading setup has been confirmed.
Learn More Lessons and Courses:
- Multi-Timeframe Analysis When Examining XAU/USD Charts
- The XAU/USD Trend Channel Indicator Available on the MetaTrader 4 Trade Platform
- Learning How to Trade and Finding Online Courses
- Retrieving and Examining XAU USD Chart Information via the MT4 Chart Data Panel
- Basics of XAU/USD
- Explaining 1:300 Leverage for XAUUSD
- MetaTrader 5 Tutorial for Learning Gold Trading Features
- How Do You Set TakeProfit XAU/USD Order on MT5 iPhone App?
- Guide to Adding Renko Chart Indicators via MT4 Meta Editor
- Setting a Stop Loss Order for XAU/USD Directly on the MT5 App
