Technique for Drawing Fibonacci Retracement Levels on Both Ascending and Descending XAUUSD Trends
The price trajectory for the XAU/USD instrument does not proceed in a perfectly straight line: rather, Gold prices ascend or descend in a fluctuating, zig-zag fashion. The Fibonacci Retracement tool is utilized to forecast the termination points of these zig-zag movements. Key retracement levels calculated are 38.2%, 50%, and 61.8%, representing likely points for a market reversal or pullback.
What's a retracement? A retracement is a retracement of price before the market resumes the original trend/original and initial direction of movement.Example Illustration of Zigzag Movement: The Example below shows price heading up in a zigzag pattern.
The diagram below shows this movement in an upwards trending market.
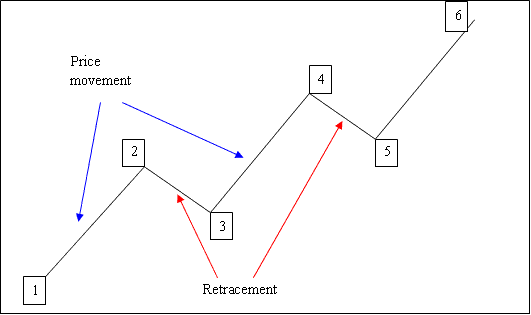
1-2: Price moves up 2-3: Pull back 3-4: Moves up 4-5: Pull-back 5-6: Moves up
Since we can accurately identify the origin of a pullback on a Gold price chart, the subsequent crucial question is determining the extent of these pullbacks. The solution lies in employing Fibonacci retracement levels.
This line tool helps predict retracement levels in XAUUSD trading. Traders place it on the price chart in their broker's platform. The tool then draws the retracement lines automatically.
What are the Fibonacci Retracement Levels?
23.6% Fib retracement38.2 % Fib retracement50.0% Fib retracement61.8 % Fib retracement
The 38.2% and 50.0% Retracement Levels are the most frequently observed turning points for price pullbacks, with the 38.2 percent Fibonacci retracement level being the most favored and widely utilized benchmark.
Traders often use the 61.8% Fibonacci retracement level to set stops with this strategy, since price usually doesn't pull back that far.
The Fibonacci retracement tool will align with the direction of the Gold price trend, as demonstrated in the examples provided.
How to Draw Fib Retracement Levels in an Upward Market Trend
In the chart below, XAUUSD rises from point 1 to 2. After point 2, it pulls back to the 50% Fibonacci level. Then it resumes the uptrend. The Fibonacci tool draws from point 1 to 2 along the gold price uptrend.
Since we are sure this is just a price bounce or pullback because we are using this technical tool, called Fib retracement, we place a buy order right in between the 38.2% and 50.00% retracement levels, and our stop loss is just under the 61.80% retracement level. If you had made a buy trade at this point in the example trade shown below, you would have gained a lot of pips, just as is illustrated below.
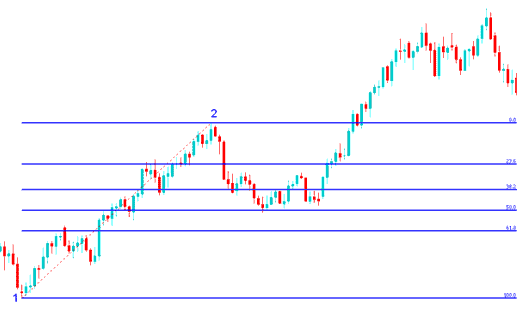
Fib Retracement Levels Drawn on an Upward Gold Market Trend
Fibonacci Retracement Trade Setup Example Explained
Following the XAU price touching the 50.0% Fibonacci retracement level, this specific level provided substantial support to the market, after which the market resumed its original upward progression and continued to appreciate.
The 23.6% Fibonacci retracement level offers minimal support and is not a preferred spot for placing an order.
In this case, the 38.2% Fibonacci level offered support. Yet price pulled back to 50%. Traders often set buy limits at 38.2%.
At 50% Fib retracement, support holds strong. In this case, buy right there for the best spot.
In this example, the price pullback touched the 50.0 percentage area, but often the price will pull back to 38.2 %, so traders often set their buy orders at the 38.2 % Fib level, while also putting their stop loss just under 61.8 % Fib level.
How do you draw Fibonacci retracement levels during a downward market trend?
Looking at the picture below, the price goes down from point 1 to point 2, and then it goes back up to the 38.2% Fib level before going down again. This Fibonacci tool is used to measure from point 1 to point 2 in the way the XAUUSD trend is going (Downwards trend).
Because we know this is just a pull back we put a sell order at 38.2% Fib retracement and a stop loss order just above 61.80 % Fib retracement.
If you had put a sell order at the 38.2 % Fib retracement like is shown on the trade below you would have made a lot of pips afterwards. In this trade the price retracement got to 38.2% Fib retracement and did not get to 50.00% Fib retracement. From experience it's always good to use 38.2% Fib retracement level when trading XAU/USD metal because most times the pull-back does not always get to 50.00% retracement mark.
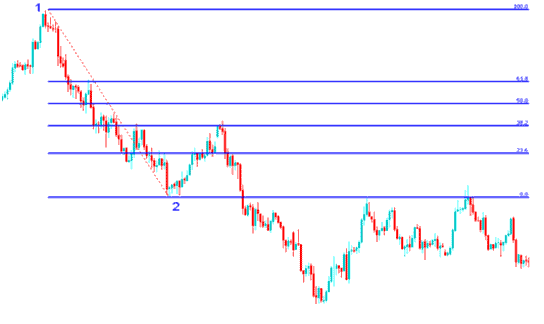
Fib Retracement Levels Drawn on a Downward Gold Market Trend
Fibonacci Retracement Trade Setup Example Explained
The example provided above represents the ideal setup where the price retraces immediately after reaching the 38.2% Fibonacci retracement level.
This Fibonacci retracement provided significant resistance for price pull-backs: it was an ideal point for traders to set a sell limit order, as the market swiftly declined after reaching the 38.2% Fibonacci retracement. For this transaction, a trader would position their stop loss order at the 61.8% Fibonacci retracement.
Learn More Topics & Courses:
- Different Trader Types for XAU/USD
- Is the Hull Moving Average reliable for XAU/USD?
- Examples of Different Divergence Setups
- Fundamental Concepts of the Gold Market for Novice Traders
- Best Leading Indicator Trend Indicator & Momentum Gold Indicator Combination
- How Can I Identify XAUUSD Upward Trend on XAUUSD Charts?
- Advice on Writing a Gold Journal With Examples
- Guide for Setting Up MT4 Software for XAUUSD Gold
- How Fast Gold Moves and Spotting Gold Trends for XAU/USD


