Fibonacci Extensions: Up and Down Trends
We covered Fibonacci retracement before, using two points. For expansion, draw from three points on the chart.
To accurately plot these levels, we await the completion of the price retracement: the XAU/USD metal then resumes its trajectory in the initial Gold price trend direction. The point reached by this pull-back serves as point 3 on the chart.
The example below marks three points for the Fibonacci expansion tool. Label them 1, 2, and 3. Point 1 starts the trend. Point 2 shows the pullback. Point 3 is the end of that retrace, as shown.
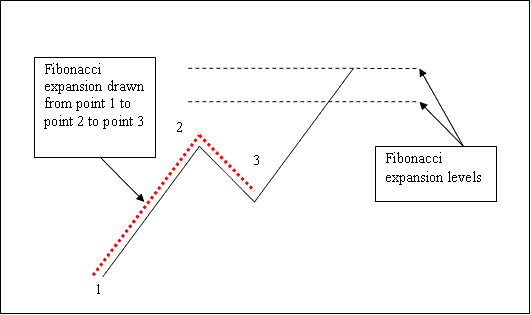
Fibonacci Expansion Levels
Note where Fibonacci expansions plot. They go above the indicator. Set take-profits in those spots.
How do you set up Fibonacci extension levels when gold prices are trending up?
Fibonacci extensions predict where prices might end up. Key levels are 61.8% and 100% expansions, used to set profit targets.
In the example below, the Fibonacci extension is aligned with the market trend. Since the trend is upward, the extension is also drawn in an upward direction.
Fibonacci extension levels appear as horizontal lines above the indicator, denoting potential profit-taking areas. In the given example, utilizing a 100% extension could yield significant profits from a buy trade.
**Note:** This trade replicates the previous example where a purchase was made leveraging Fibonacci retracement around the 38.2% Fib retracement level. Simultaneously, the 100% Fibonacci extension level was used to determine the take-profit target. Find a Gold price chart and practice these trading approaches.
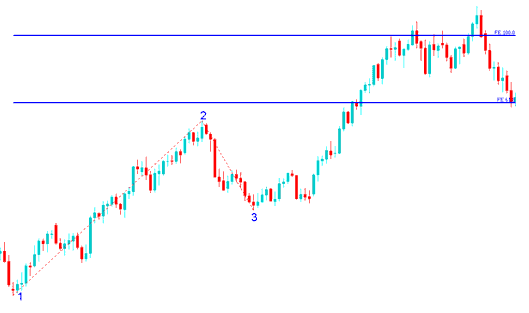
Fibonacci Expansion Levels Drawn on an Upward XAUUSD Price Trend
In the cases shown earlier, the uptrend kept going. Price touched both the 61.8% and 100.0% Fibonacci Expansion levels. Then it pulled back after reaching the 100.0% Fib extension point.
Drawing Fibonacci Expansion Levels in Response to a Declining Gold Price Trend.
Considering we employ this tool for estimating target profit (tp) orders, how should its application be demonstrated on a declining XAUUSD price trend?
We draw the Fibonacci extension tool from point one to two to three, as shown below. Always match it to the trend direction. In this example, we drew it down because the trend heads down. Compare the up draw above to the one below. Use the 100% level too. Notice where price hit. That spot made a solid take-profit zone.
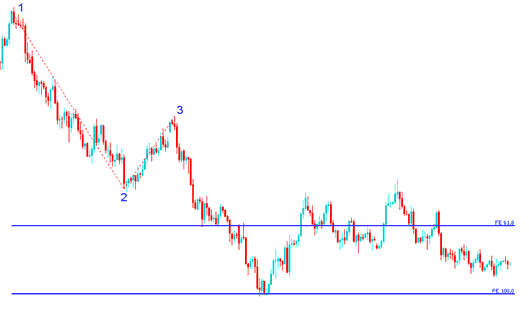
Fibonacci Expansion Levels Drawn on a Downward XAUUSD Market Trend
In the aforementioned example, upon drawing the Fibonacci extension indicator, two levels are identified to indicate potential profit-taking areas, represented as horizontal lines across the price chart (these levels correspond to the 61.8% Fibonacci expansion level and 100% Fibonacci extension level as demonstrated previously).
Get More Lessons and Topics:
- Bollinger Bands Technical Gold Indicator Analysis
- Trading Gold Using Combined MACD Fast Line and MACD Signal Line Strategies
- Finding the Best XAU/USD Brokers and Platforms for Beginners
- What Happens When Free Gold Margin Is Depleted?
- A System for XAU/USD That Makes XAUUSD Buy & Sell Signals
- Trade Signals with Inertia Indicator for Forex Sell Options
