Drawing Downward Trend-Lines & Channels
A Downwards trend line is a line drawn on the XAUUSD chart when the general and overall trend of the prices is moving downward & hence this line is drawn above these downward trending prices by joining at least two highs of the downwards price trend. This line will show the general and overall trend of the market price to be downward.
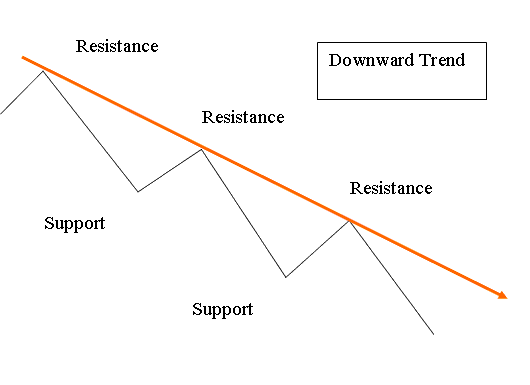
This idea is illustrated in the graphic that follows, which also shows how prices fluctuate during a negative trend. As the market declines, it continues to establish new resistance levels, which are used to construct the downward trendline.
Because the market tends to go up and down, traders usually draw a line to show the general direction it's moving, which might be down.
Downward Trending Market
A downward trend happens when the price of Gold keeps making lower low points and lower high points. Each high point is less than the high point before it - a lower high, and each low point is less than the low point before it - a lower low, which shows the price is going down.
Downtrend lines grow stronger each time price hits but bounces off. The downtrend holds until lower highs and lows end.
In technical analysis, breaking above a downtrend line signals a buy. It often hints that gold prices may reverse from bearish or pause.
Drawing a Downwards Trend-Line
When the online XAUUSD metal market moves down it forms lower lows & lower highs forming a bearish market movement. A downwards trend line can then be plotted by connecting/joining these lower highs.
For this setup, resistance areas created by market prices are used. Properly drawing a downward trend line necessitates two resistance areas. When the price touches or tests this downward trend line, we enter a buy order and establish a stop loss a few pips above the trend line. The corresponding diagram provides an example of a downward trend line.
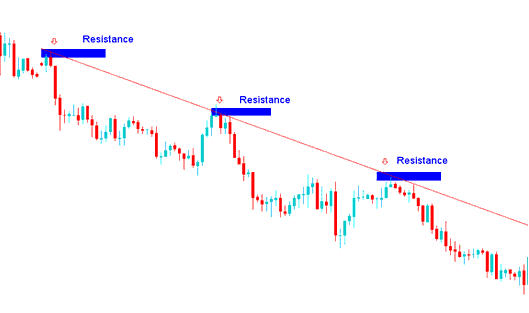
Downward Trendline - Gold Trading
The established trend line indicates an overall bearish orientation for the Gold market, meaning traders should exclusively initiate sell trade positions provided the price action remains within the parameters of this setup and below the established resistance levels. These levels serve as crucial points where, should the price manage to recover, they will present robust and significant barriers to further upward movement. This is precisely why numerous sellers opt to wait for the price to ascend and touch these retracement points before entering sell trades. Transactions opened at these specific junctures typically boast a superior Risk:Reward Ratio and are highly lucrative.
In the above setup the trader would have opened sell/short trade transactions from the signals generated at the resistance1, resistance2, resistance3 & these trade positions would have made a lot of profits with minimum amount of drawdown/retracement. This is why a lot of traders like to trade using this trend-line trading setup.
Drawing Downward Channel
A downwards channel is created when a line is made that runs alongside the Downward trend-line, and then this new line is moved to touch the lowest point of price changes. This then makes a channel for the price, and if the market stays inside these 2 channels, the dropping market movement of Gold prices will keep going downward.
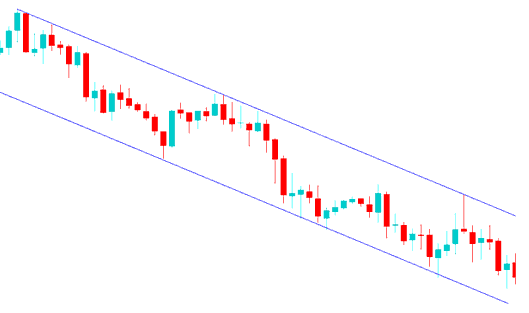
Downward Channel Pattern in XAUUSD Trades
Trading the Downwards Gold Prices Channel
Traders of XAU/USD employ this downward channel to identify optimal take-profit levels. Gold traders typically secure profits when prices touch or test the lower channel, anticipating another retracement before opening subsequent sell trades.
MT4 Tools for Drawing Downwards Trendline and Channels
The drawing tools required for these setups in MT4 are located on the MT4 drawing toolbar within the platform interface. To reveal this toolbar if it is currently inactive in your software, navigate to "File" at the top left of MT4, click on "View" next to it, then select "ToolBars," and finally, check/select the "Lines Toolbar" by clicking on it.
The screenshot below shows the MT4 trend line tool. To add a trend line on a Gold chart, select the tool and pick your starting point.
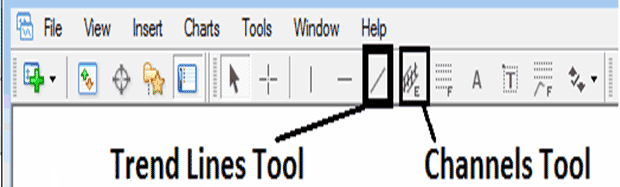
MetaTrader 4 Tool-Bar for Drawing Downwards Trendline and Channels
Get More Tutorials and Tutorials:
- Trading Strategies for Fibonacci Extension in XAU/USD
- Steps to Configure Commodity Channel Index (CCI) Indicator for XAU/USD
- How do you trade when price hits 100.0% Fibonacci level?
- Key Characteristics of the Three Major XAU/USD Trading Sessions
- Learn How to Generate Signals using Gold Methods
- Types of XAUUSD Bar Charts & Types of Bar Charts in XAUUSD


