Divergence Trading Setups Summary - Gold TRADING
Classic Bearish Divergence Setup - HH price, LH indicator - Indicates under-lying weakness of a price trend - Warning of a possible reversal in the market trend from upward to downward.
The Classic Bullish Divergence trading setup - characterized by lower lows on price and higher lows on the indicator - signals underlying trend weakness and warns of a potential reversal from downward to upward.
Hidden bearish divergence: higher low in price, higher high in indicator. It points to trend momentum. Common in downtrend pullbacks.
Hidden bullish divergence shows up when price makes higher lows, but the indicator shows lower lows. This pattern points to building momentum, often during a pullback in an uptrend.
Example Illustrations of Divergence Trading Setup Terms:
M-shapes dealing with price highs
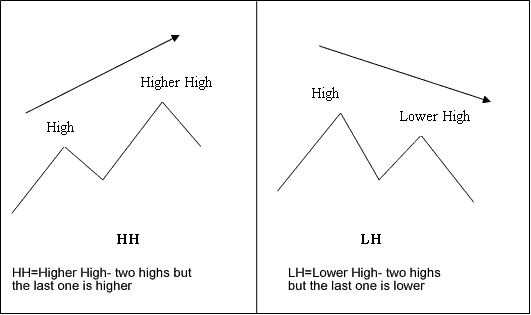
M shapes: Divergence Trading Terms
W-shapes dealing with the price lows
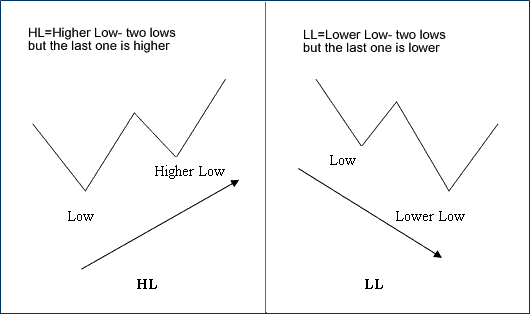
W shapes: Divergence Trading Terms
These are the shapes to look for when using the divergence trading setups.
One of the best indicators for using with this divergence trading setup is the MACD Indicator - as a divergence trading signal, MACD divergence setup is a high probability setup to enter a trade. But as with any trading signal there are certain parameters which have to be looked at to make this trading signal a high probability setup.
Getting straight into a position as soon as you as a trader see this setup is not the best strategy to use. This divergence trading setup should be used in combination with another indicator to confirm the market direction of the XAUUSD price trend. A good trade system to combine this setup with is the MA crossover strategy.
Note that this setup matters less on short time frames. Divergence on a 15-minute chart may not count much compared to a 4-hour or daily chart.
If you see it on a 60 minute chart, 4 hour chart, or daily time frame, start looking for other things that might show when the price might react to the divergence.
This brings us to a main point when using this trading signal to start a trade: a MACD divergence setup signal on a longer timeframe can be a pretty good sign that the price direction will change. But, the big question is: WHEN? That's why starting a trade right away when you see this divergence setup isn't always the best plan.
Traders often enter too early on MACD divergence. The market still holds momentum in its current direction. That early jump leaves them watching the screen. Prices hit their stop loss. They get taken out of the trade.
If you only look for this divergence trading setup without considering other factors, you won't have the best chance of success. To improve your chances of winning, you should also consider other things, especially other indicators.
What other factors should you consider when using this divergence trading setup?
1. Support, Resistance & Fibonacci on higher timeframes. Boost your win odds by checking bigger charts first. Base your lower timeframe orders on that view.
Check the hourly, four-hour, or daily chart if it hits a key resistance, support, or Fibonacci level. This boosts the odds of a winning trade from a divergence signal on a shorter chart.
2. Reward to risk ratioAnd finally, when searching for divergence trading set-ups, it is very crucial that you enter the trade correctly, so that as you have a good risk: reward ratio & only open trades which have more profit potential than what you are risking. If you understand how to open a trade transaction properly, you can measure your risk : reward ratio before you open a trade position. That way, you can only choose to open trading orders which offer a favorable risk:reward ratio.
Used right - and with other indicators to back up the signal - divergence trading setups can be a solid method for trading XAUUSD.
Study More Lessons and Courses:
- How to Come Up with MT4 XAU USD Automated Robot for XAU/USD
- A Practical Guide and Tutorial for Training Beginner Traders in XAUUSD
- How do you set pending limit and pending stop orders in XAU/USD?
- How to Find a Regulated XAU USD Broker
- XAU USD Price Action 1-2-3 Method Price Breakout in XAUUSD Charts
- How Gold Leverage Greatly Increases XAU USD Profits & XAU USD Losses
- Setup Instructions for the MT4 XAUUSD Trading Software
- Understanding Bullish Reversal Chart Patterns
- XAU/USD Strategies That Actually Work
- Definition and Explanation of the TTF Indicator as a Buy Trading Signal in Technical Analysis


